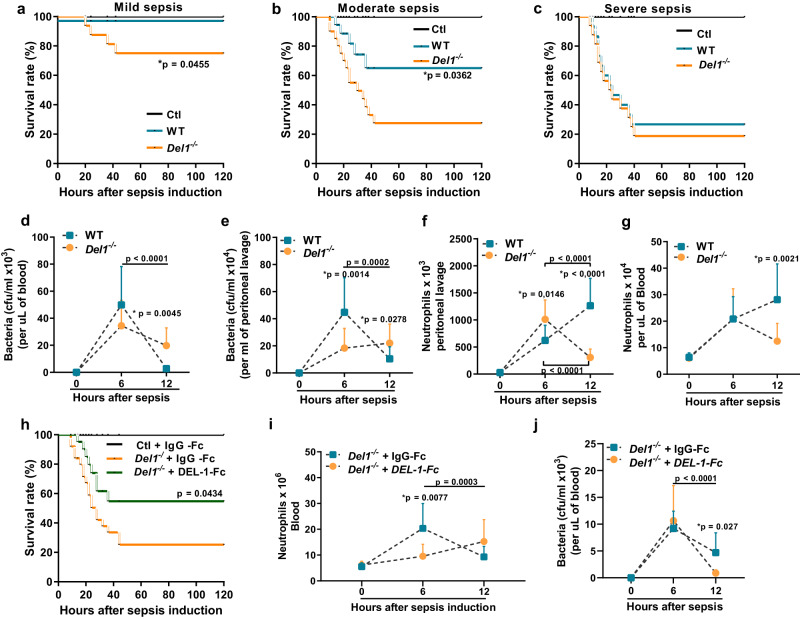
Fig. 4. DEL-1 promotes neonatal sepsis survival via enhancement of circulating neutrophil pool.
Survival rates of wild type (WT) and Del1−/− C57BL/6 neonate mice after cecal slurry (CS) induced sepsis of either a mild (n = 16 animals per group), b moderate (n = 16 animals per group), or c severe severity (n = 16 animals per group). Bacterial counts, expressed as colony forming units (cfu) in d blood (n = 13 animals in WT 6 h, n = 12 animals in WT 12 h, n = 14 animals in Del1−/− 6 h and n = 9 animals in Del1−/− mice 12 h group) (in the 0 h time point the value was set to 0), and e peritoneum (n = 13 animals in WT 6 h, n = 8 animals in WT 12 h, n = 13 animals in Del1−/− 6 h and n = 8 animals in Del1−/− 12 h) (in the 0 h time point the value was set to 0). Neutrophils (CD11b+ Ly6G+) in (f) peritoneal lavage (n = 7 animals in WT 0 h, n = 14 animals in WT 6 h and n = 12 animals in WT 12 h, n = 6 animals in Del1−/− 0 h, n = 17 animals in Del1−/− 6 h and n = 10 animals in Del1−/− 12 h) and g blood (n = 4 animals in WT 0 h, n = 21 animals in WT 6 h, n = 12 animals in WT 12 h, n = 4 animals in Del1−/− 0 h, n = 19 animals in Del1−/− 6 h and n = 11 animals in Del1−/− 12 h group) in WT and Del1−/− C57BL/6 neonate mice 6 and 12 hours following CS-induced sepsis. h Survival rates of Del1−/− C57BL/6 neonate mice treated with i.v. DEL-1-Fc or IgG-Fc 15 min prior to injection of CS (n = 25 animals per group). i Neutrophils (CD11b+Ly6G+) (n = 5 animals in IgG-Fc Del1−/− 0 h, n = 17 animals in IgG-Fc Del1−/− 6 h, n = 15 animals in IgG-Fc Del1−/− 12 h, n = 5 animals in Del1−/− 0 h, n = 8 animals in DEL-1-Fc in Del1−/− 6 h and n = 10 animals in DEL-1-Fc Del1−/− 12 h group) and j bacterial counts (cfu) in the blood of Del1−/− neonate pups treated with either i.v. DEL-1-Fc or IgG-Fc 6 and 12 hours following CS-induced sepsis (n = 4 animals in IgG-Fc Del1−/− 6 h, n = 8 animals in IgG-Fc Del1−/− 12 h, n = 7 animals in DEL-1-Fc Del1−/− 6 h and n = 9 animals in DEL-1-Fc Del1−/− 12 h group) (in the 0 h time point the value was set to 0). Statistical analysis by Log-rank (Mantel-Cox) test in survival experiments (a–c, h). Mean ± SD (d, e, f, g, i, j) is depicted. Statistical analysis by one-way ANOVA with Bonferroni’s multiple comparison post-test (d–g, i, j) or by two-sided unpaired t test (d–g, i, j, indicated with *) to compare between WT and Del1−/− or IgG-Fc Del1−/− and DEL-1-Fc Del1−/− groups at a specific timepoint following CS-induced sepsis. Source data are provided as a Source Data file. Ctl control.

