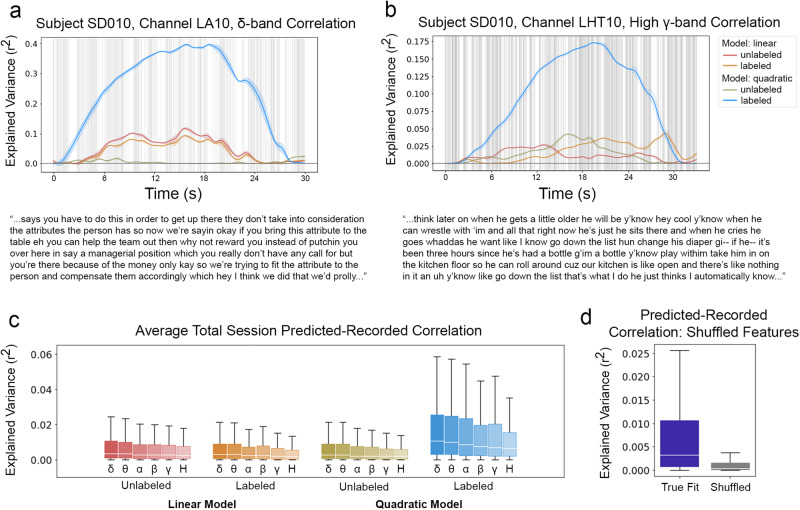
Fig. 7. Combined with phonemic label information, stimulus covariance structure best predicts the neural response to speech across all response bands.
Time-varying variance explained by the MNE models for the delta (a) and high-gamma (b) power responses of single electrodes, illustrating periods of sustained advantage of the labeled quadratic model (blue) over other models. Gray vertical lines indicate phoneme boundaries for the transcripts provided below each plot. c Average variance explained by the MNE models for all subjects, broken out by model type and neural response band (n=1255 electrodes per boxplot). d Average variance explained by the MNE models for all true fit models vs. all shuffled models (n=30,120 electrodes per boxplot). In (c) and (d), white horizontal lines indicate distribution medians, colored boxes show the IQR, and black whiskers extend a further 1.5 IQR.

