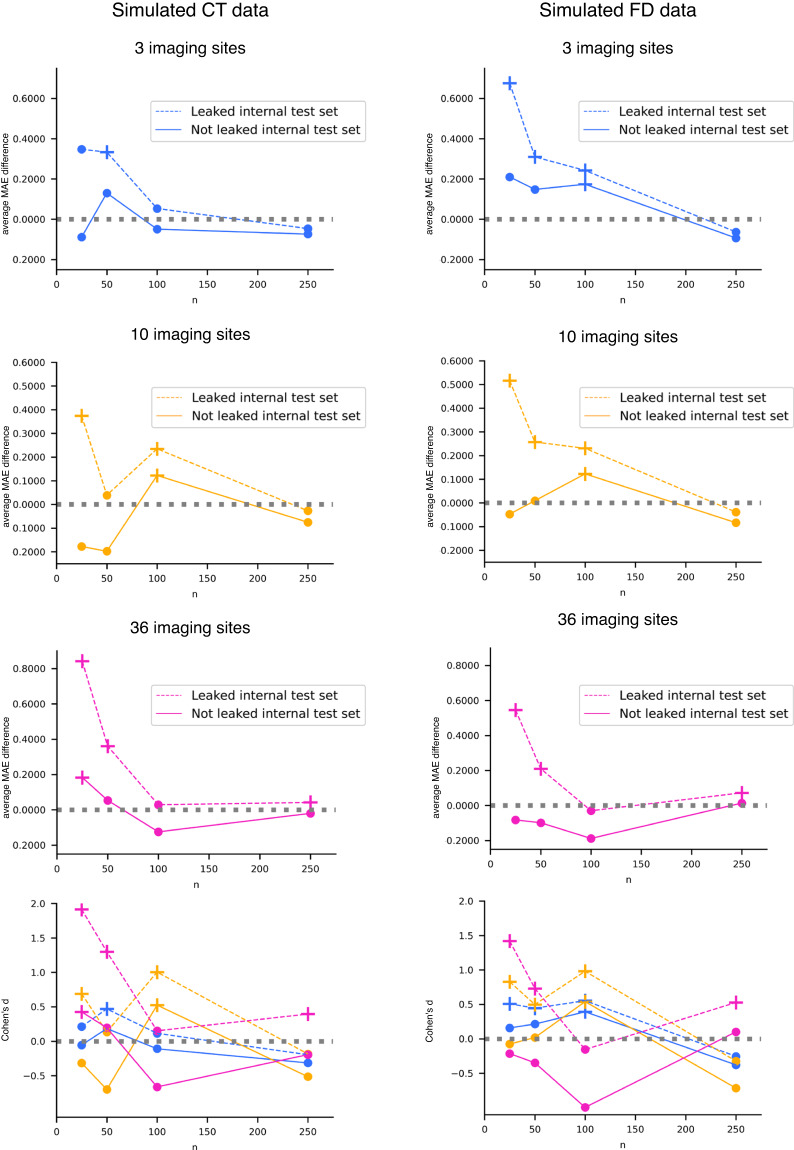
Fig. 6.
Age prediction results with CT and FD simulated data. We reported the difference between the average MAE obtained in the external test set and that gained in the internal test sets (dotted line for leaked internal test set and solid line for not leaked internal test set) and Cohen’s d effect size vs. the number of participants per single-center dataset n. The cross marker indicates a significant difference between balanced accuracy distributions (see Tables 5, 6 for details). The colors and line types in Cohen’s d plots are consistent with those employed in the other plots.

