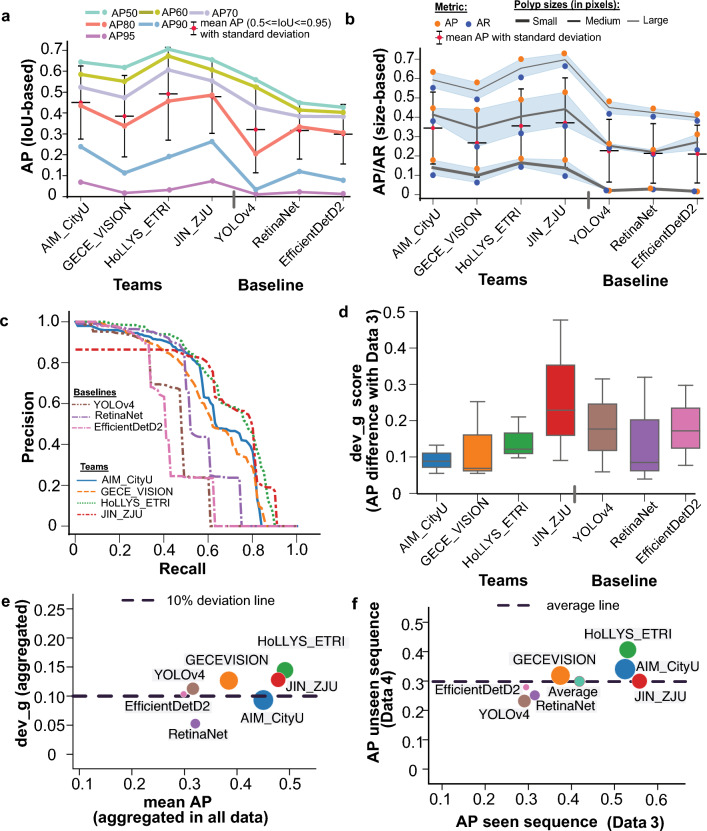
Figure 4.
Assessment of detection methods: (a,b) demonstrate mean average precision (AP) in both IoU-based and polyp size-based average precision. The downward trend towards the right signifies lower values for the baselines than the team values. In (b), the top of the blueish region represents the average precision (AP), while the bottom represents the average recall (AR). The black line demonstrates the mean of these two values. Both AP and AR are preferred to be higher. (c) Precision-recall (PR) curve for detection task for all test sets (aggregated). A separate PR-curve for each test set is shown in Supplementary Figure 2. (d) Deviation in mAP scores for data 1, data 2 and data 4 wrt data 3. The box plot with a lower interquartile range and median value demonstrates lower deviation and improved generalisability. Clearly, most teams have lower deviations compared to baseline methods. (e,f) Generalisation assessment on detection task for which mean average precision (mAP) on all data versus deviation computed between seen centre with unseen modality and unseen centre is provided in (e). The least deviation (below the dashed line) with a larger mean average precision (mAP in the X-axis) is desired. Similarly, a comparison of mAP for both teams and baseline methods on seen centre sequence data (C1–C5, data 3) versus unseen centre sequence data, C6 (data 4). Higher values along both axes are desired. The size of the circle only refers to a different team or baseline method for better illustration.

