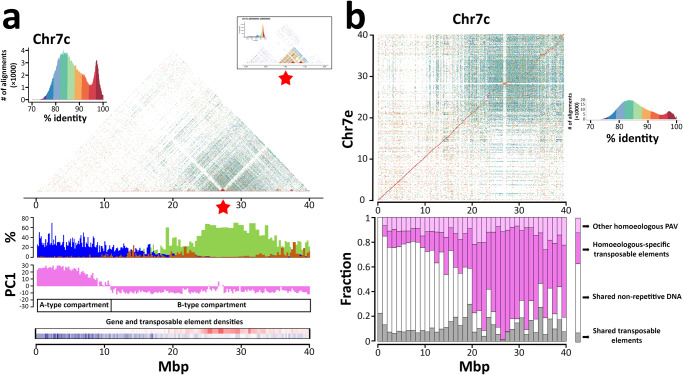
Fig. 2. Sequence and structural variation between homoeologous chromosomes in euchromatic and heterochromatic regions.
a Composition and chromatin organization of Chr7c. Sequence identity heatmap on top of the panel with a tandem repeat array of a highly conserved 2.7 Kb monomer indicated by the red asterisk and magnified in the inset; histograms of gene (blue), Athila- (brown) and chromovirus-derived (olive green) sequence abundances, expressed as percentage of exonic base pairs (genes) and percentages of masked base pairs by RepeatMasker using intact Coffea Athila and Chromovirus sequences across 4,467 non-overlapping genomic windows containing 100 Kb of non-repetitive DNA and histograms of PC1 values defining A/B compartments using non-overlapping genomic windows of 100 Kb. b Comparison between Chr7c and Chr7e. Each dot represents sequence alignments with >70% of identity between non-overlapping 2 Kb windows. The color of each dot represents the % of sequence identity. Box plots represent the fraction of nucleotides shared between (white and gray) or private to (pink and magenta) the homoeologs. These categories are further sorted into the fraction of nucleotides in annotated transposable elements (gray and magenta) and in non-repetitive DNA (white). The pink stack includes low-copy DNA as well as other DNA tracts that are not annotated as transposable elements outside of collinear regions. In both panels, x-axis indicates million base pairs (Mbp). Source data are provided as a Source Data file.

