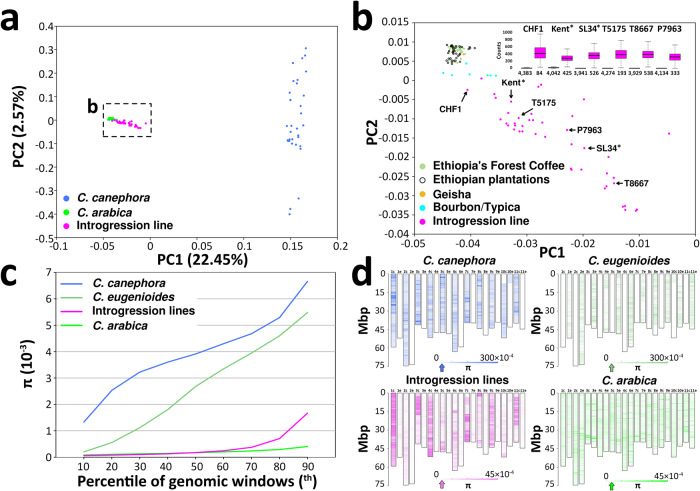
Fig. 3. Genetic diversity in 172 Coffea sp. accessions.
a Bidimensional plot of the first two components of a Principal Component Analysis (PCA). It has to be noted that the accession of C. eugenioides is not included in a and it is provided in Supplementary Fig. 43 and the accession C. canephora 33-1 has been removed from both PCAs due to low coverage (Supplementary Data 1). b Magnified view of the section of the bidimensional plot delimited by the rectangle in a. b (inset) Box plot distribution of the number of SNPs per genomic window of 100 Kb of non-repetitive DNA sorted based on residing in regions free of C. canephora introgression (olive green boxes to the left of each variety) or in regions carrying C. canephora introgression (magenta boxes to the right of each variety) in 3 Arabica-like specimens as well as 3 Timor hydrid derivatives (P7963, T5175 and T8667). Boxes indicate the first and third quartiles, the horizontal line within the boxes indicates the median and the whiskers indicate ±1.5 × interquartile range. Numbers below each box indicate the number of genomic windows in each genome compartment. Percentile distribution (c) and chromosomal distribution (d) of nucleotide diversity (π) across 4,467 non-overlapping genomic windows containing 100 Kb of non-repetitive DNA. In d, the arrows on the bar scales point to median values, y-axes indicate million base pairs (Mbp). *The sequenced specimens BioSamples SAMN10411969 and SAMN10411970 are indicated here as Kent and SL34, respectively, consistent with their SRA metadata. Source data are provided as a Source Data file.

