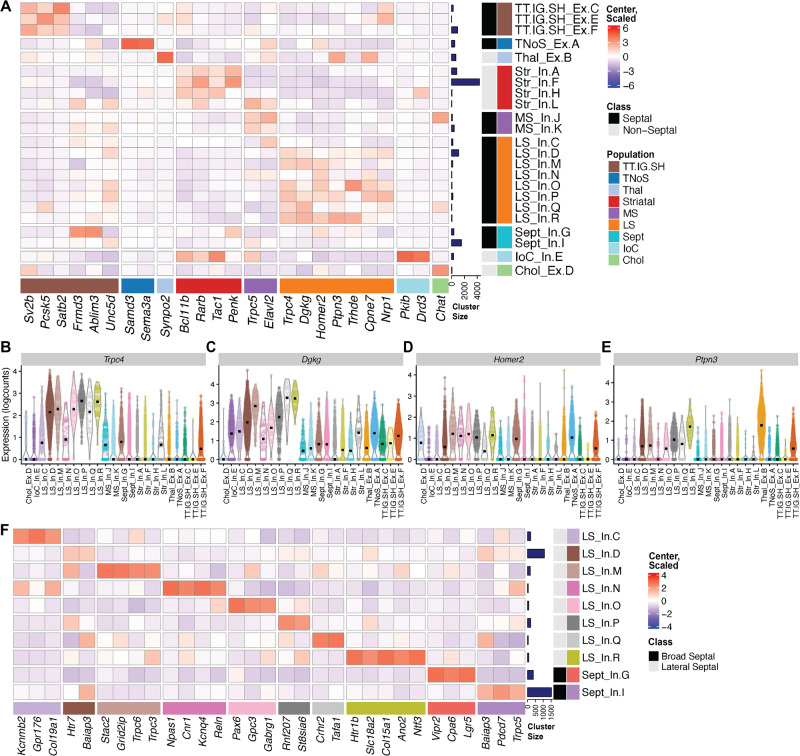
Fig. 3. Characterization of neuronal clusters within mouse LS.
A Heatmap of marker genes for various brain regions used to characterize neuronal clusters. Violin plots showing (B) Trpc4, (C) Dgkg, (D) Homer2, and (E) Ptpn3 expression, which were identified as specific markers for LS neurons. F Heatmap of identified cell type-specific markers for each of the LS neuronal clusters. Heatmaps show transformed-normalized expression values (logcounts), centered and scaled.

