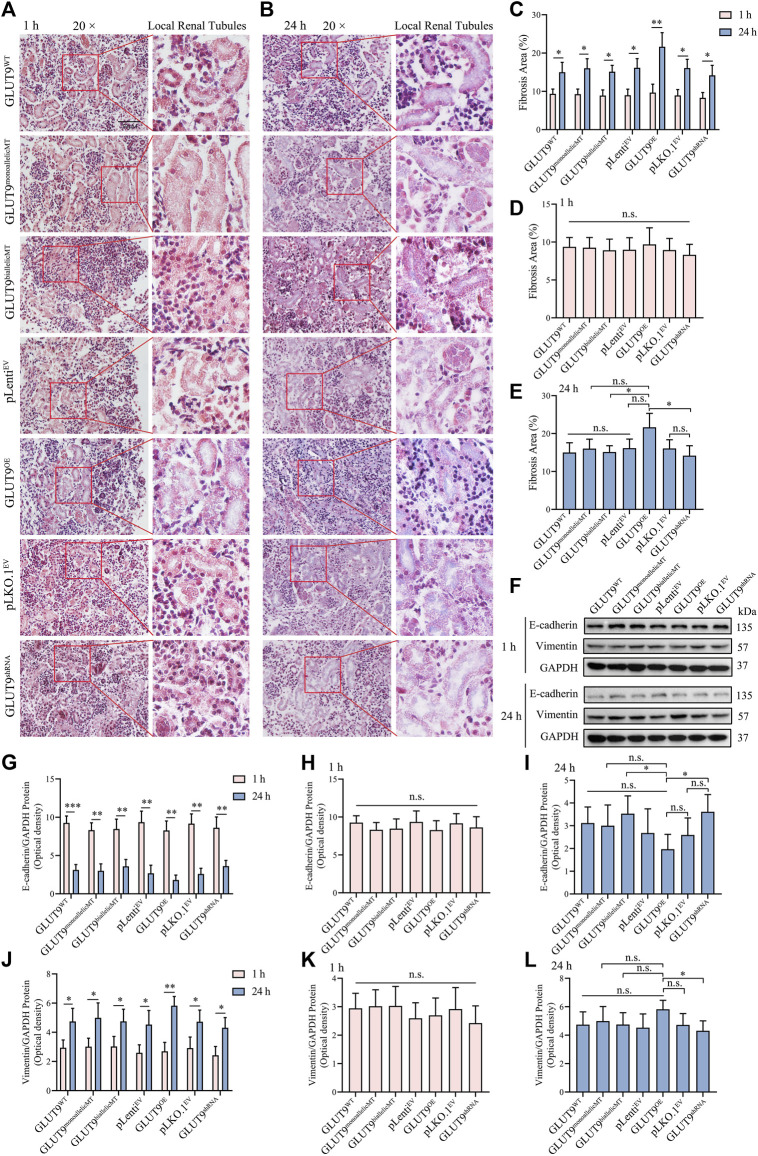
FIGURE 5.
Hyperuricosuria induces EMT in kidney organoids. (A, B) Masson staining showing the lager blue areas of 24-h kidney organoids compared with those in 1-h kidney organoids (Scale bars, 50 μm; ×20 objective). (C) The quantitative Masson staining data show significant differences (n = 3, *p < 0.05, **p < 0.01). (D) The fibrosis extents in the kidney organoids of different experimental groups at 1 h were similar (n.s., not significantly). (E) At 24 h, the fibrosis extent in GLUTOE kidney organoids was significantly higher than those in GLUT9biallelicMT and GLUT9shRNA organoids (n = 3, *p < 0.05; n. s., not significantly). (F) Western blot data showing that the expression of vimentin was higher and that of E-cadherin lower after 24 h than those after 1 h (G–L) Western blot (WB) quantitative data showing statistically significant differences (n = 3, *p < 0.05, **p < 0.01, ***p < 0.001, n. s., not significantly).

