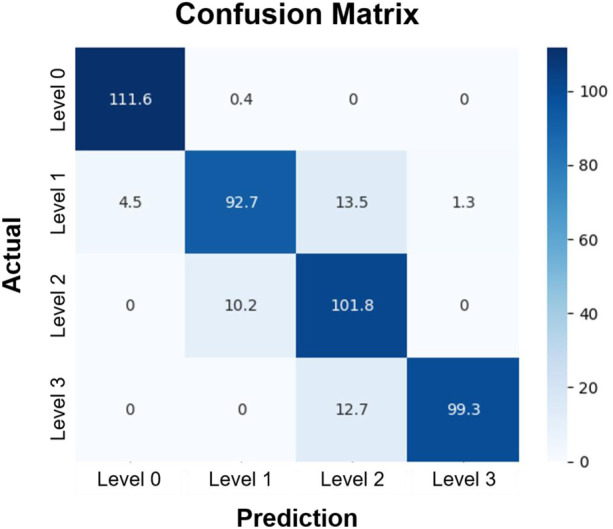
FIGURE 6.

Confusion matrix of the classification of GRC levels. Rows and columns represent the actual and predicted GRC levels of experimental data, respectively. Each element of the matrix indicates the number of data that fell into the specified category, averaged over 10 folds. The test data included 112 images in each GRC level. In this classification, we used the convolutional neural network with the step decay learning rate ( = 0.001). GRC: gemcitabine-resistant bladder cancer.
