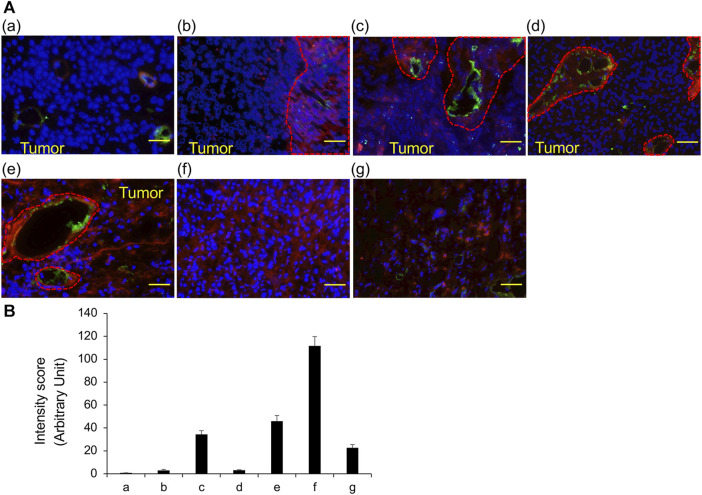
FIGURE 2.
VVL staining of frozen sections obtained from TURBT observed using fluorescence microscopy (A) The representative fluorescent images of bladder cancers. VVL (Red), CD31 (Green) and nuclei (Blue) are shown. (a) Low-grade non-invasive urothelial carcinoma; (b) Low- and high-grade non-invasive urothelial carcinoma; (c) High-grade invasive urothelial carcinoma; (d) High-grade invasive urothelial carcinoma; (e) Muscle invasive urothelial carcinoma, sarcomatoid variant; (f) Muscle invasive urothelial carcinoma, plasmacytoid variant; (g) Small-cell carcinoma. Scale bars = 50 μm. (B) Scoring of VVL staining intensity was performed using the ImageJ software. Data represent the mean ± SEM of each three spot of each photo.

