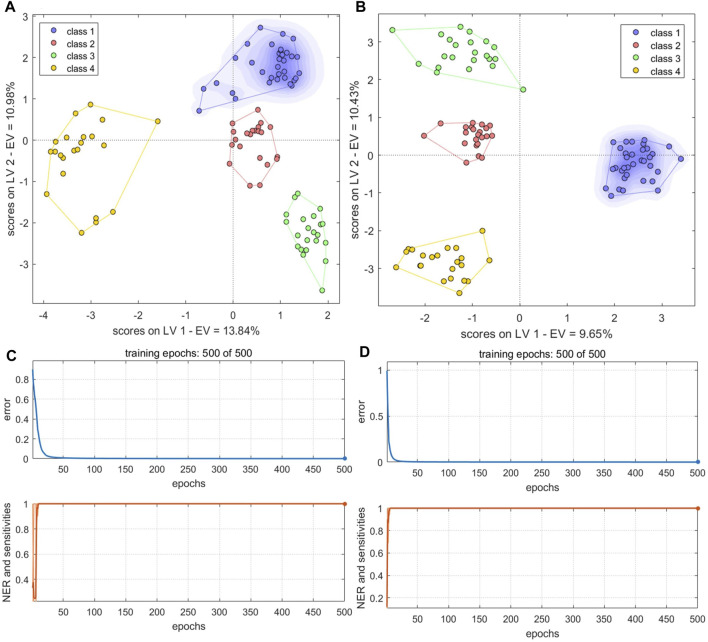
FIGURE 11.
PLS-DA score plots and the number of training iterations and error rates for models of species identification. (A,B) PLS-DA score plots for models built with fused PCs (A) and LVs (B) (C,D) Training iterations and error rates of BP-NN model built on fused PCs (C) and LVs (D). Class1, BS; class2, GE; class3, PO; class4, BOS.

