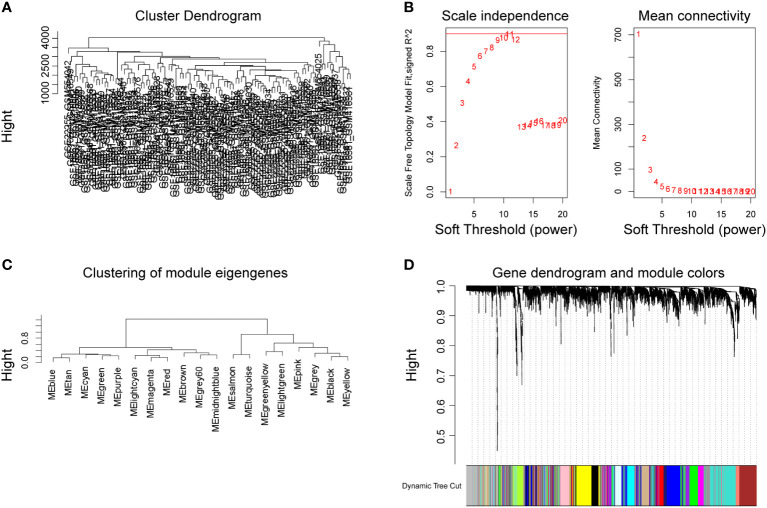
Figure 3.
Establishment of WGCNA network of DEGs. Cluster tree of 102 samples after clipping (A). Analysis of the scale-free exponent and the average connectivity of each soft threshold, the red line indicates the minimum soft threshold of 9 for constructing the scale-free network (B). Clustering of modular characteristic genes for all DEGs (C). Gene dendrogram for all DEGs (D).

