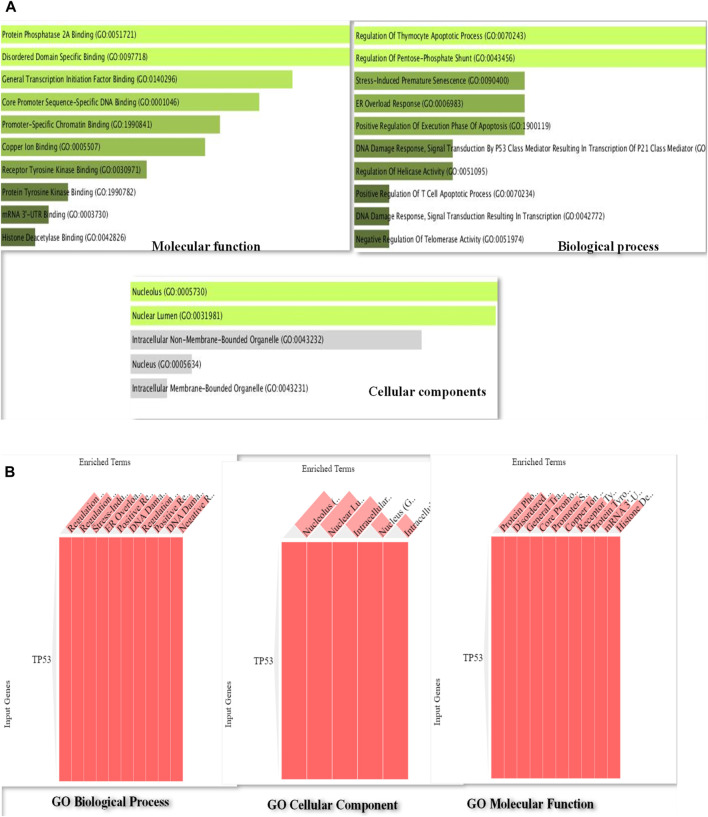
FIGURE 3.
(A): Bar diagram of Gene Ontology analysis of P53 protein representing the involvement of P53 in important pathways such as regulation of apoptosis execution phase, DNA damage response, and signal transduction and helicase activity. (B): Gene Ontology cluster diagram representing the extent of the impact of P53 on several important pathways including molecular, cellular, and biological processes.

