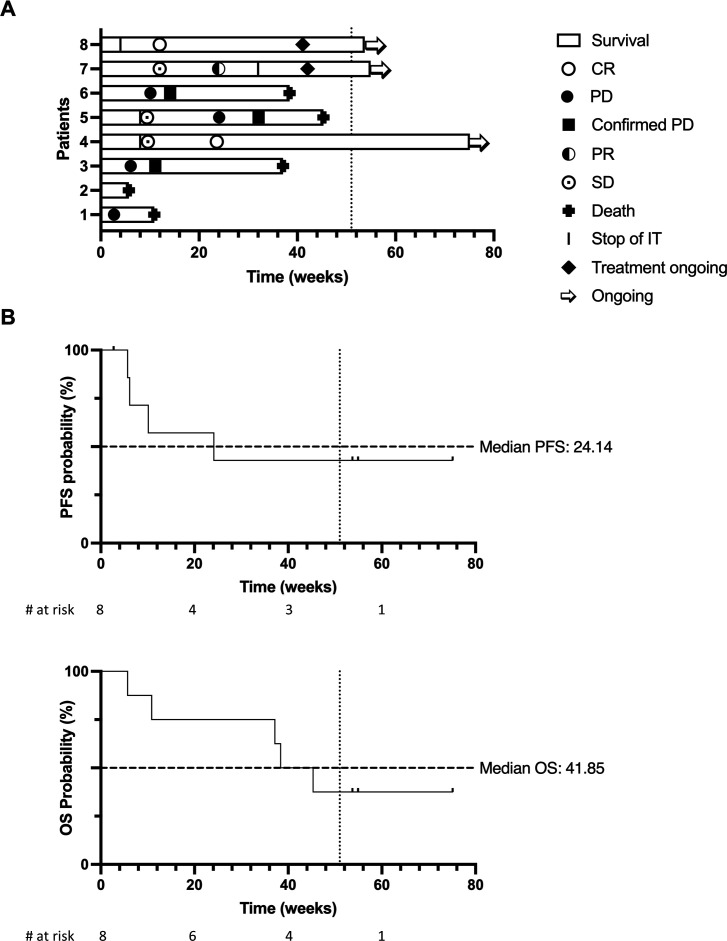
Figure 2.
(A) Swimmer plot representing response at each evaluation, duration of treatment and survival of each patient at data cut-off. Bars depict overall survival. Arrow indicates patient remaining alive. Complete response (CR), progressive disease (PD), partial response (PR), stable disease (SD) marked as per figure legend. Stop of intratumoral indicates end of intratumoral injections (continuation of intravenous treatment). Planned end of study treatment protocol (52 weeks) is depicted as vertical dotted line. (B) Kaplan-Meier survival estimates for progression-free survival (PFS) (left) and overall survival (OS) (right) in weeks since start of study treatment. Median survival in weeks is indicated on the curve as a horizontal dotted line. Planned end of study treatment protocol (52 weeks) is depicted as vertical dotted line.

