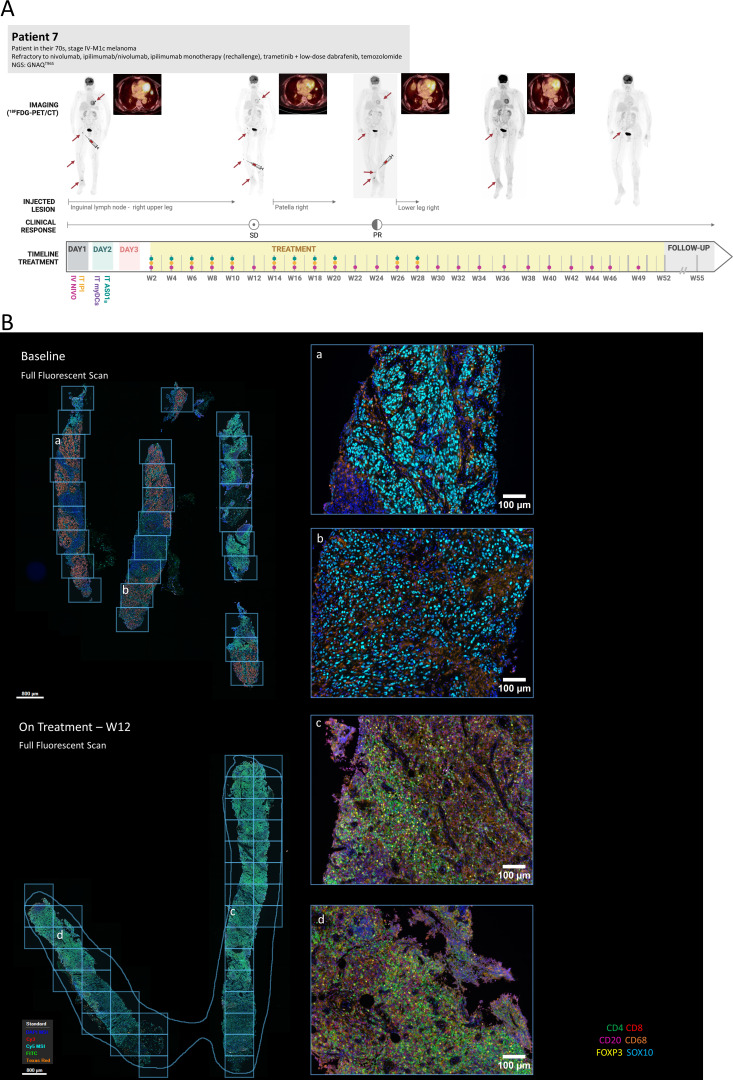
Figure 3.
Case illustration and treatment disposition of patient 7. (A) Timeline depicts time since first treatment administration. Dots indicate treatment administration as indicated on day 1 and day 2. Arrows indicate significant lesions. Syringe indicates injected lesion. Whole body 18F-FDG-PET/CT images are shown, together with a zoomed axial fusion image (PET/CT) of the lung lesion (non-injected). (B) Representative images from multiplex immunohistochemistry analysis at baseline (upper panel) and while on treatment (week 12, lower panel). Left images are overview full fluorescent scans before spectral deconvolution with indication (grid) of individual multispectral images (MSI) analyzed. Right images show selected MSI and analysis of immune cell composition of tumor region indicating a progressive decrease of detectable tumor region and influx of immune cells (mostly CD4 and CD8) while on treatment. IV, intravenous; IT, intratumoral; myDCs, myeloid dendritic cells; NGS, next generation sequencing results (mutated genes); PD, progressive disease; PR, partial response; SD, stable disease.

