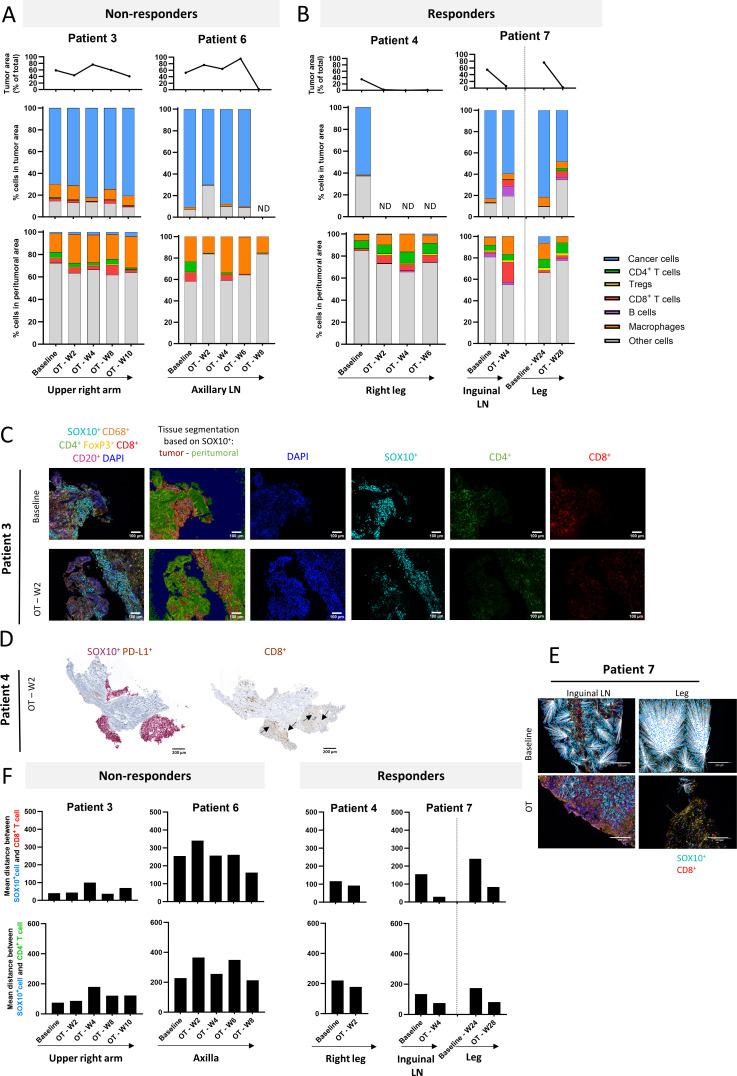
Figure 4.
Immune composition of tumor and peritumoral regions: Results from multiplex immunohistochemistry analysis. (A and B) Upper panel: proportion of tumor cells (SOX10+) in biopsy sample. Middle panel depicts cellular composition of the tumor area. Lower panel depicts cellular composition of the peritumoral area. Time on treatment and injected lesion is indicated beneath the graphs. For patient 7, first biopsy (at 24 weeks on treatment) of leg lesion before intratumoral injection of this lesion was considered as baseline for this lesion. (C) Microscopic multiplex immunohistochemistry image of patient 3 tumor samples at baseline and on-treatment (week 2), illustrating exclusion of both CD4+ and CD8+ T cells from the SOX10+ tumor region. Scale bar=100 µm. DAPI, 4',6-diamidino-2-fenylindool; FoxP3, forkhead box P3. (D) Immunohistochemistry slide showing SOX10 and CD8 immunohistochemistry staining on consecutive slides (containing a considerable tumor area) demonstrating presence of CD8+ T cells in the tumor region. Scale bar=200 µm. (E) Visual representation of decreasing distance between CD8+T cells and SOX10+ melanoma cells in patient 7, both baseline and on-treatment. For patient 7, first biopsy (at 24 weeks on treatment) of leg lesion before intratumoral injection of this lesion was considered as baseline for this lesion. White lines indicate distance between respective cells. Scale bar=200 µm. (F) Graphs representing mean distance between SOX10+ melanoma cells and CD8+ (upper panel) or CD4+ (lower panel) T cells in non-responders (left) and responders (right) as measured on one tissue slide. A notable decrease can be observed in both CD4+and CD8+ T cells in the responding patients. Tregs = regulatory T cells, ND = not detected, LN = lymph node

