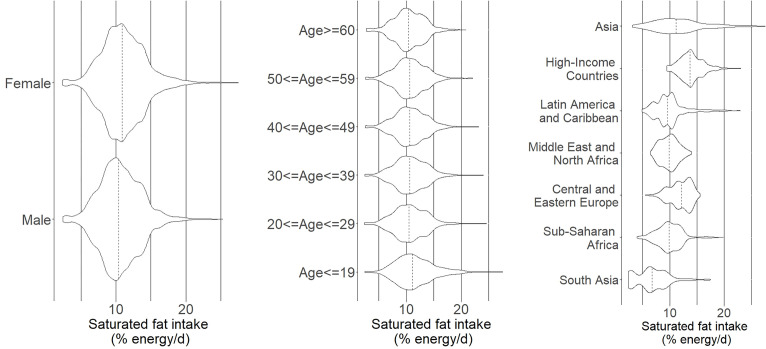
Figure 1.
Comparison of percentage energy from saturated fat among individuals in sex, age and country-specific strata globally and across world regions. Note that n=7040 (160 countries×44 demographic subgroups). Female: n=3520 and male: n=3520. Age categories: age ≤19, n=1920; age ≥60, n=2560 and for all other age groups, n=640. Regions: South Asia, n=308; Sub-Saharan Africa, n=1892; Central and Eastern Europe, n=1188; Middle East and North Africa, n=704; Latin America and Caribbean, n=1276; high-income countries n=1056 and Asia, n=616. Source: Global Dietary Database, 2018.

