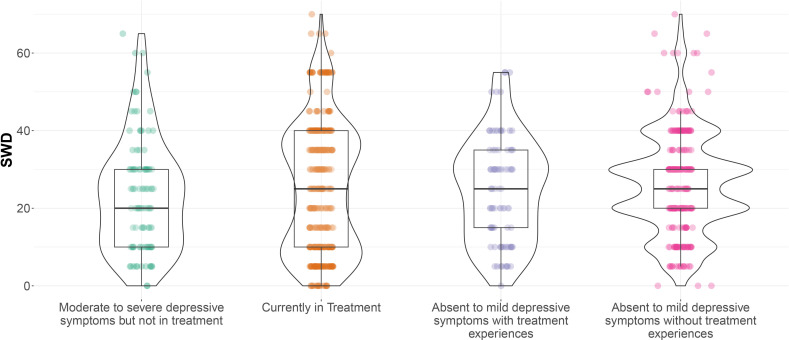
Figure 2.
Box-violin plots of the SWD distributions for four participant groups. Boxes represent the second and third quartiles with the median line in the middle. Whiskers represent the range. Violins represent the frequency distribution, enhanced with raw data points. The sample used to estimate the figure does not include 95 participants who reported they would not take antidepressants for depression even if response were 100%. SWD, smallest worthwhile difference.

