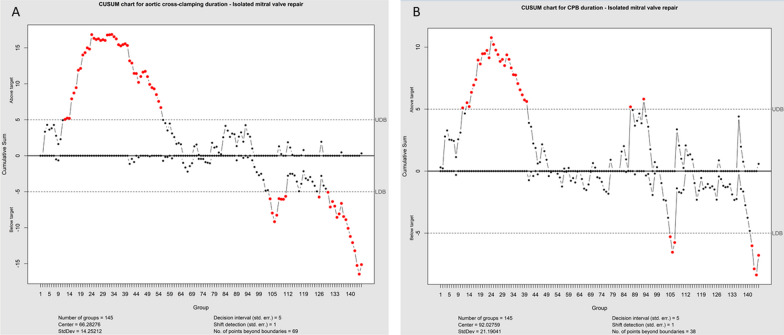
Fig. 3.
CUSUM chart for aortic cross-clamping time (A) in isolated mitral valve repair reveals higher cross-clamping times (CUSUM curve above upper decision limit) for cases 12–55 (year 2013–2016). Afterward (cases 56–103) reduction towards the center of group statistics with lower cross-clamping times (CUSUM curve below lower decision limit) for cases 104–111 (year 2018), case 126 (year 2019), and cases 130–145 (year 2019) was detected. Higher CPB times were seen for mitral valve repair (B) for cases 11–40. Afterward, there was a reduction towards the group's center with lower CBP times for cases 105–107 and 142–145

