Fig. 6.
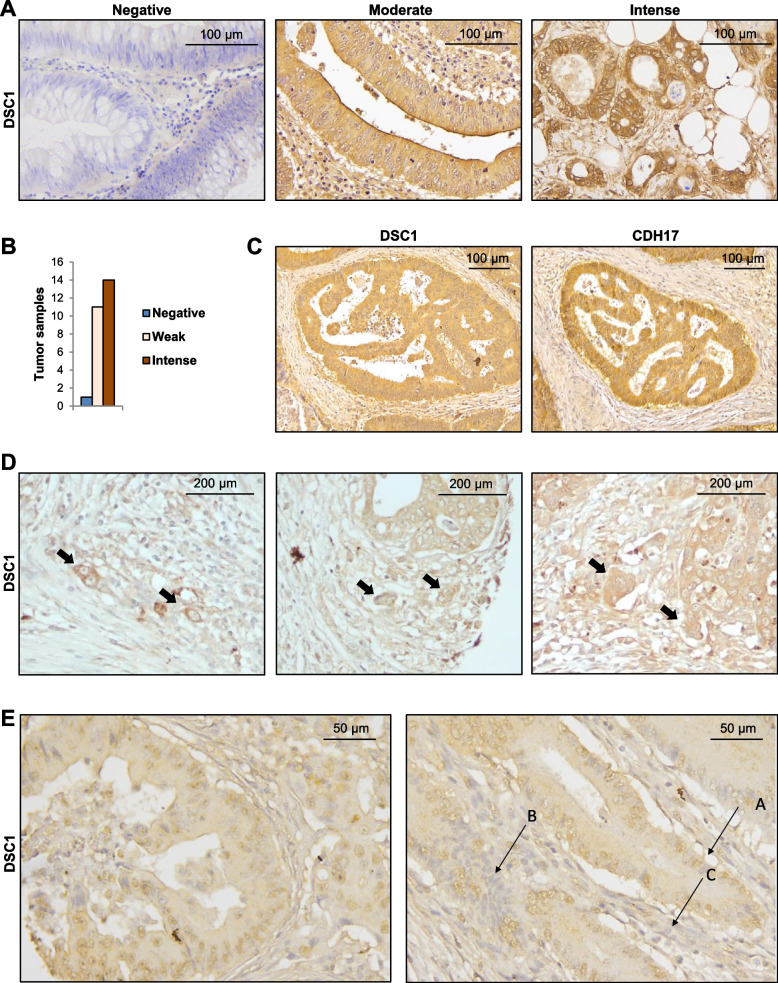
DSC1 expression in colon cancer samples. A Representative images of negative, moderate and intense DSC1 staining in colon cancer tissue samples subjected to immunohistochemistry. B Quantification of DSC1 staining in the analyzed tumor samples. C Representative images of DSC1 and CDH17 staining in serial tissue sections of colon cancer samples. D Representative images of the tumor invasive front showing the expression of DSC1 in budding cells (black arrows). E Representative images of DSC1 nuclear staining. Cells labeled with A and B showed positive and negative nuclear staining of tumor cells, respectively, whereas the C region indicates negative nuclear staining in fibroblasts

