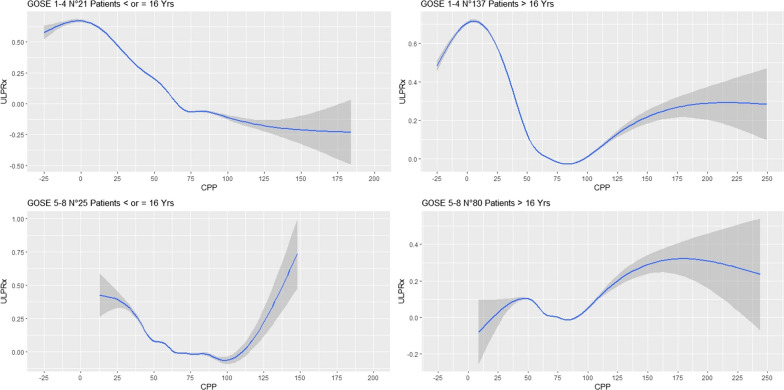
Fig. 4.
A–D Visual examination of UL-PRx dynamics and CPP stratified by age and GOSE. The results, visually represented in the figure by smoothing curves and confidence intervals, clearly show a gradual escalation of high UL-PRx values indicating impaired cerebral autoregulation (CA), especially at low CPP values (CPP below the threshold of about 50 mmHg). Of note, individuals with unfavorable outcomes tend to have lower CPP values and thus show a more pronounced increase in UL-PRx. The figure provides valuable insight into the relationship between CPP and UL-PRx in different age groups and categories of the Glasgow Outcome Scale and sheds light on the potential impact on cerebral autoregulation in patients with traumatic brain injury

