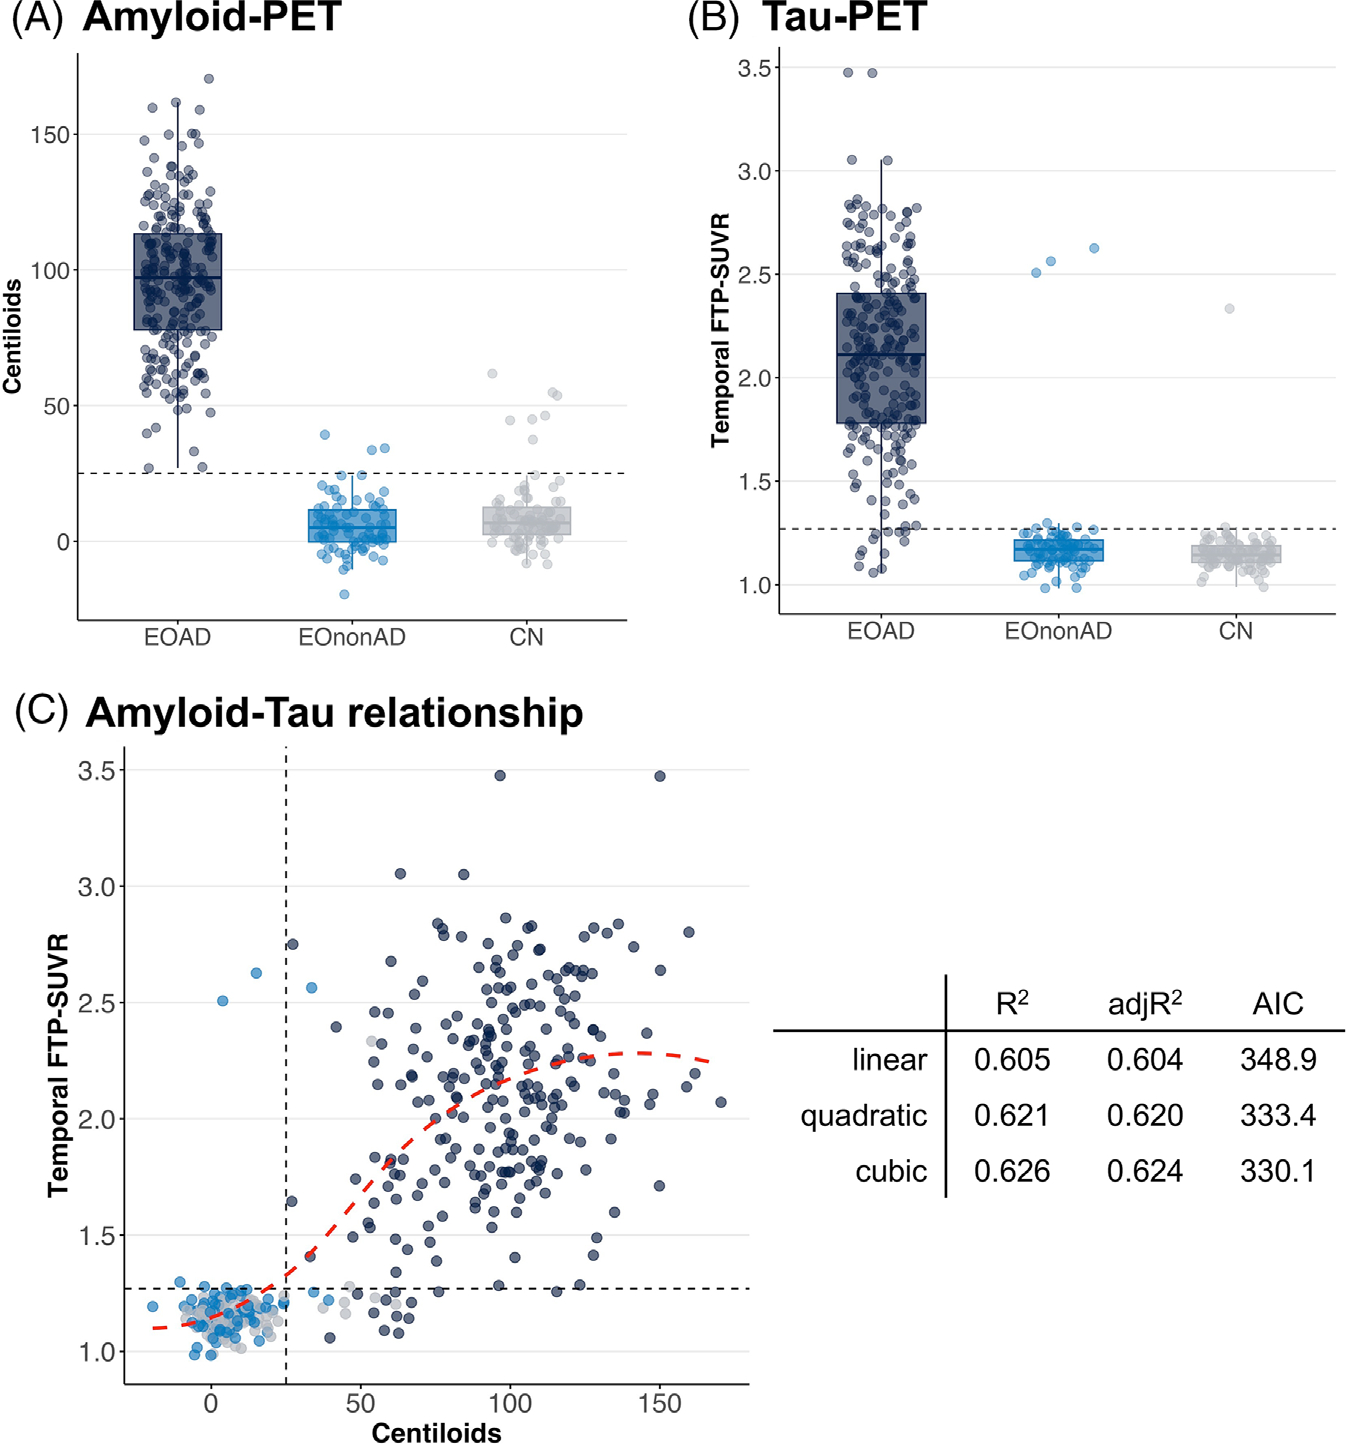
FIGURE 2.

Summary metrics of amyloid- and tau-PET across groups. Distribution of Centiloid (A) and temporal FTP-SUVR (B) values across the three groups. (C) The association between Centiloid and temporal FTP-SUVR, with summary metrics for linear, quadratic, and cubic models. The red dotted line shows a data-driven smooth regression line using the locally estimated scatterplot smoothing (LOESS) method. Dotted lines indicate pre-determined positivity thresholds of 25 Centiloid for amyloid-PET (A and C) and 1.27 temporal meta-ROI FTP-SUVR (B and C). See Figure S2 for tau-PET analyses using global cortical SUVR instead of temporal SUVR. FTP, 18F-Flortaucipir; PET, positron emission tomography; ROI, region of interest; SUVR, standardized uptake value ratio
