
FIGURE 4.
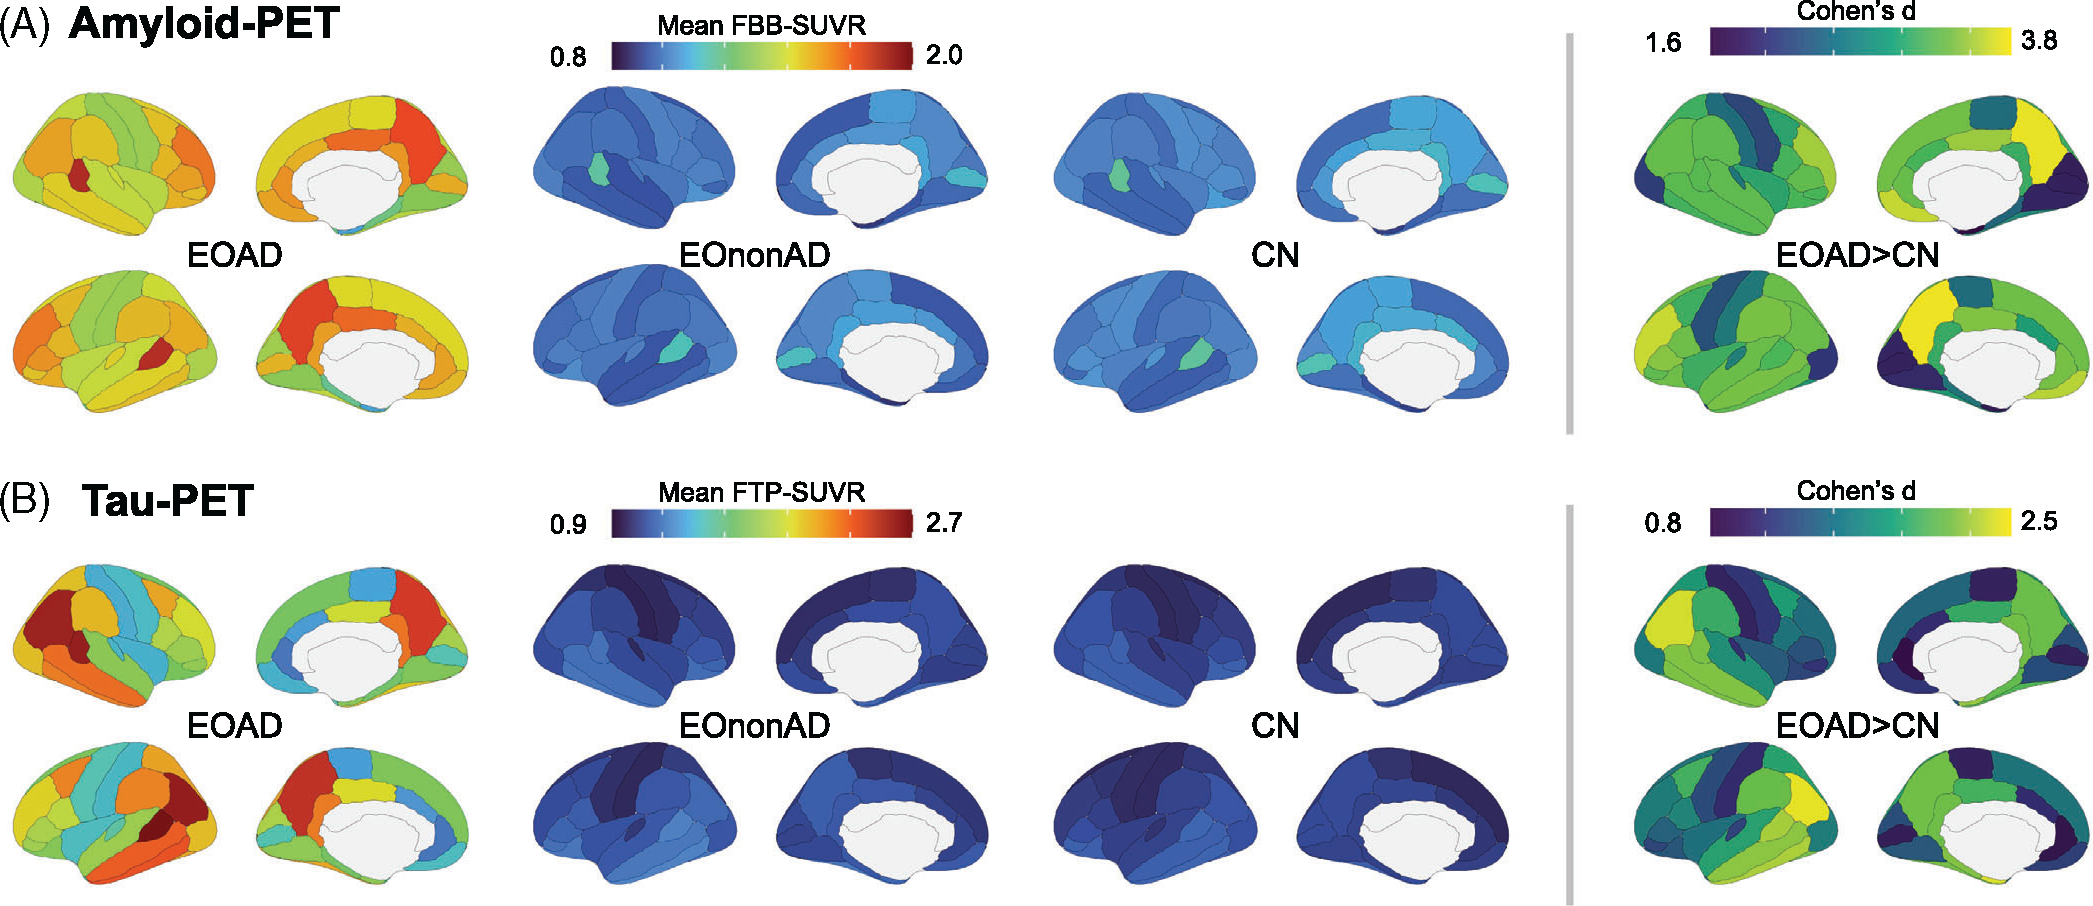
Regional distribution of amyloid- and tau-PET signal in the EOAD group. Regional distribution of amyloid- (A) and tau (B)-PET signal in all groups. Mean SUVR values were extracted from 68 cortical ROIs from the Desikan-Killiany atlas. The right panel shows group differences between EOAD and CN groups, quantified as Cohen’s d effect sizes (all 68 ROIs are different with Bonferroni-corrected p < 0.05). All pairwise group comparisons are described in detail in Table S1. CN, cognitively normal; EOAD, early-onset Alzheimer’s disease; PET, positron emission tomography; ROI, region of interest; SUVR, standardized uptake value ratio