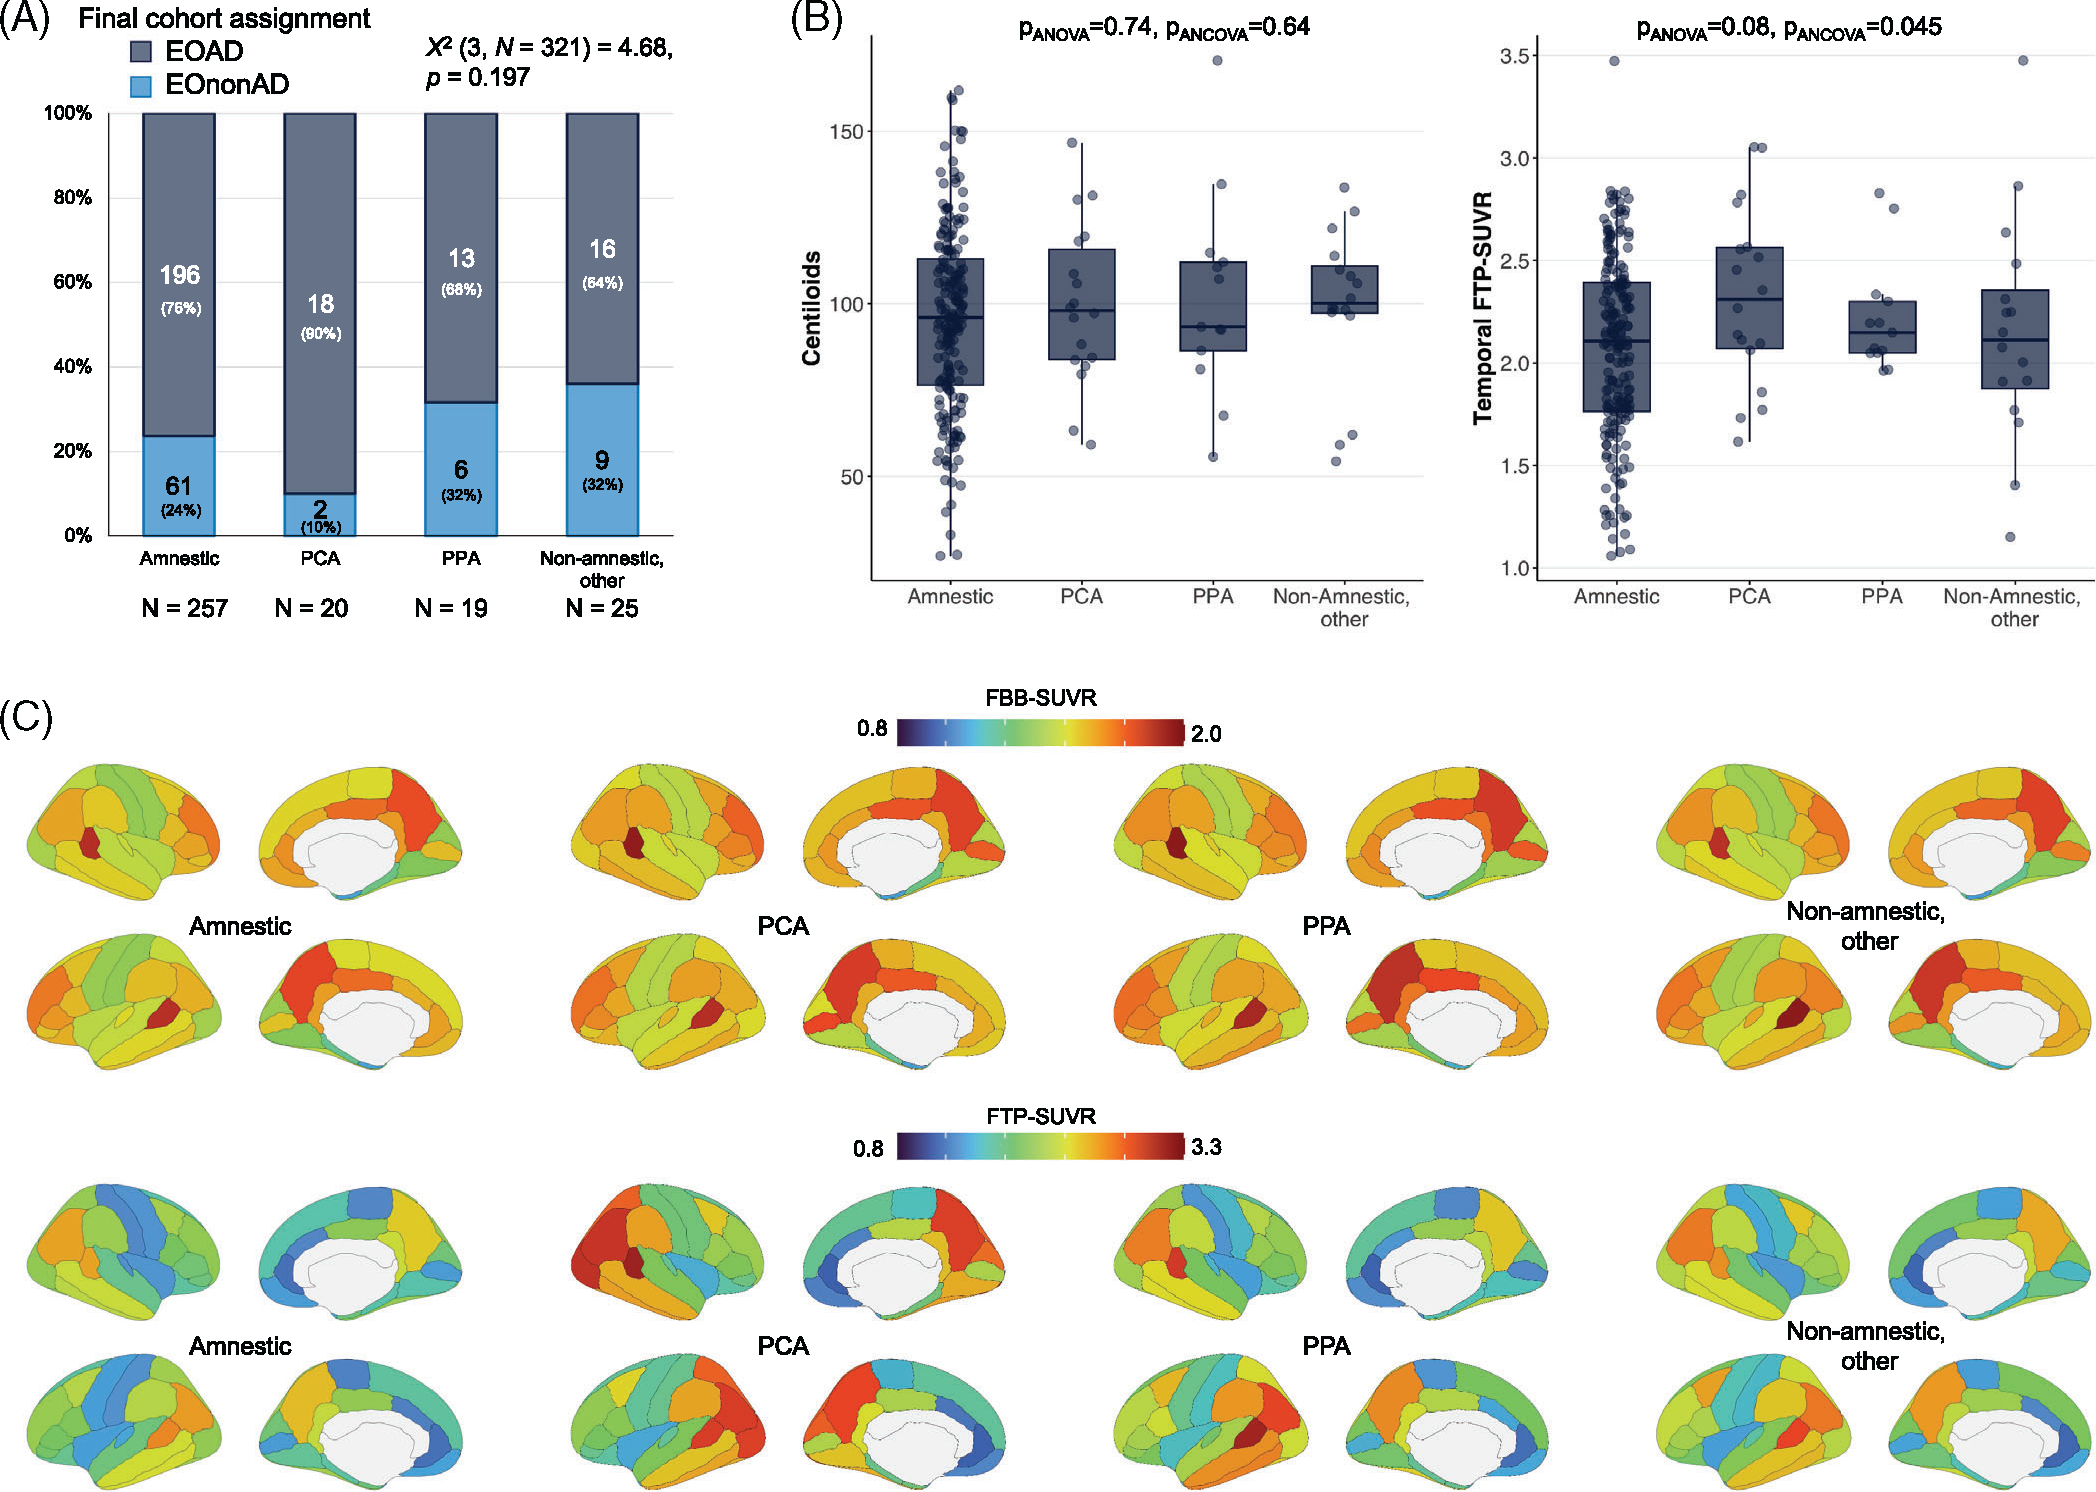
FIGURE 6.

Clinical phenotypes in clinically impaired participants: exploratory analyses. (A) Proportion of cases that were assigned to the EOAD versus EOnonAD groups based on the amyloid-PET screening (see Figure 1a). (B) Summary metrics of amyloid and tau PET for each clinical phenotype in the EOAD group (n = 196 amnestic, 18 PCA, 13 PPA, 16 other non-amnestic cases); see Figure S3 for demographic and clinical information, and Figure S3 for tau-PET analyses using global cortical SUVR instead of temporal SUVR. Groups were compared using Welch’s analysis of variance (“pANOVA”) and using an analysis of covariance controlling for age and sex (“pANCOVA”). (C) Regional distribution of amyloid (Florbetaben, top) and tau (Flortaucipir, bottom) PET in each clinical phenotype in the EOAD group (same Ns as in panel B). See Table S4 and Figure S3 for statistical comparisons. EOAD, early-onset Alzheimer’s disease; EOnonAD, early-onset non-Alzheimer’s disease; PCA, posterior cortical atrophy; PET, positron emission tomography; PPA, primary progressive aphasia; SUVR, standardized uptake value ratio
