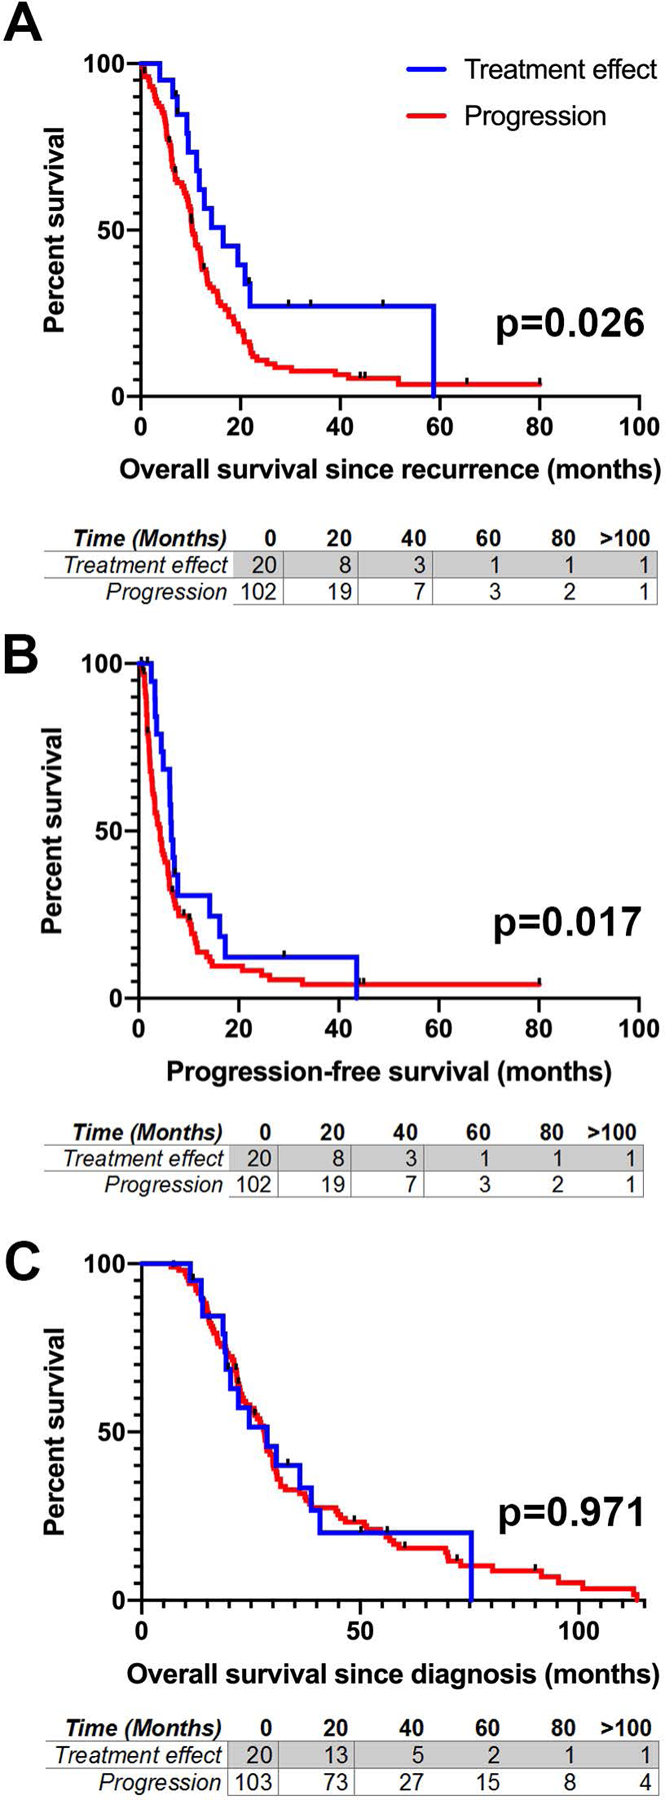
Figure 2.

Survival analysis in recurrent glioblastoma. A Overall survival from the time of repeat resection for presumed GBM recurrence. B Progression-free survival from the time of repeat resection as defined by subsequent radiographic progression. C Overall survival from time of initial GBM diagnosis. In all instances blue lines represent patients with treatment-related changes on pathology, red lines represent true disease progression. Tables below each figure indicate the number of patients at risk at each given timepoint. P-values reported from Gehan-Breslow-Wilcoxon test.
