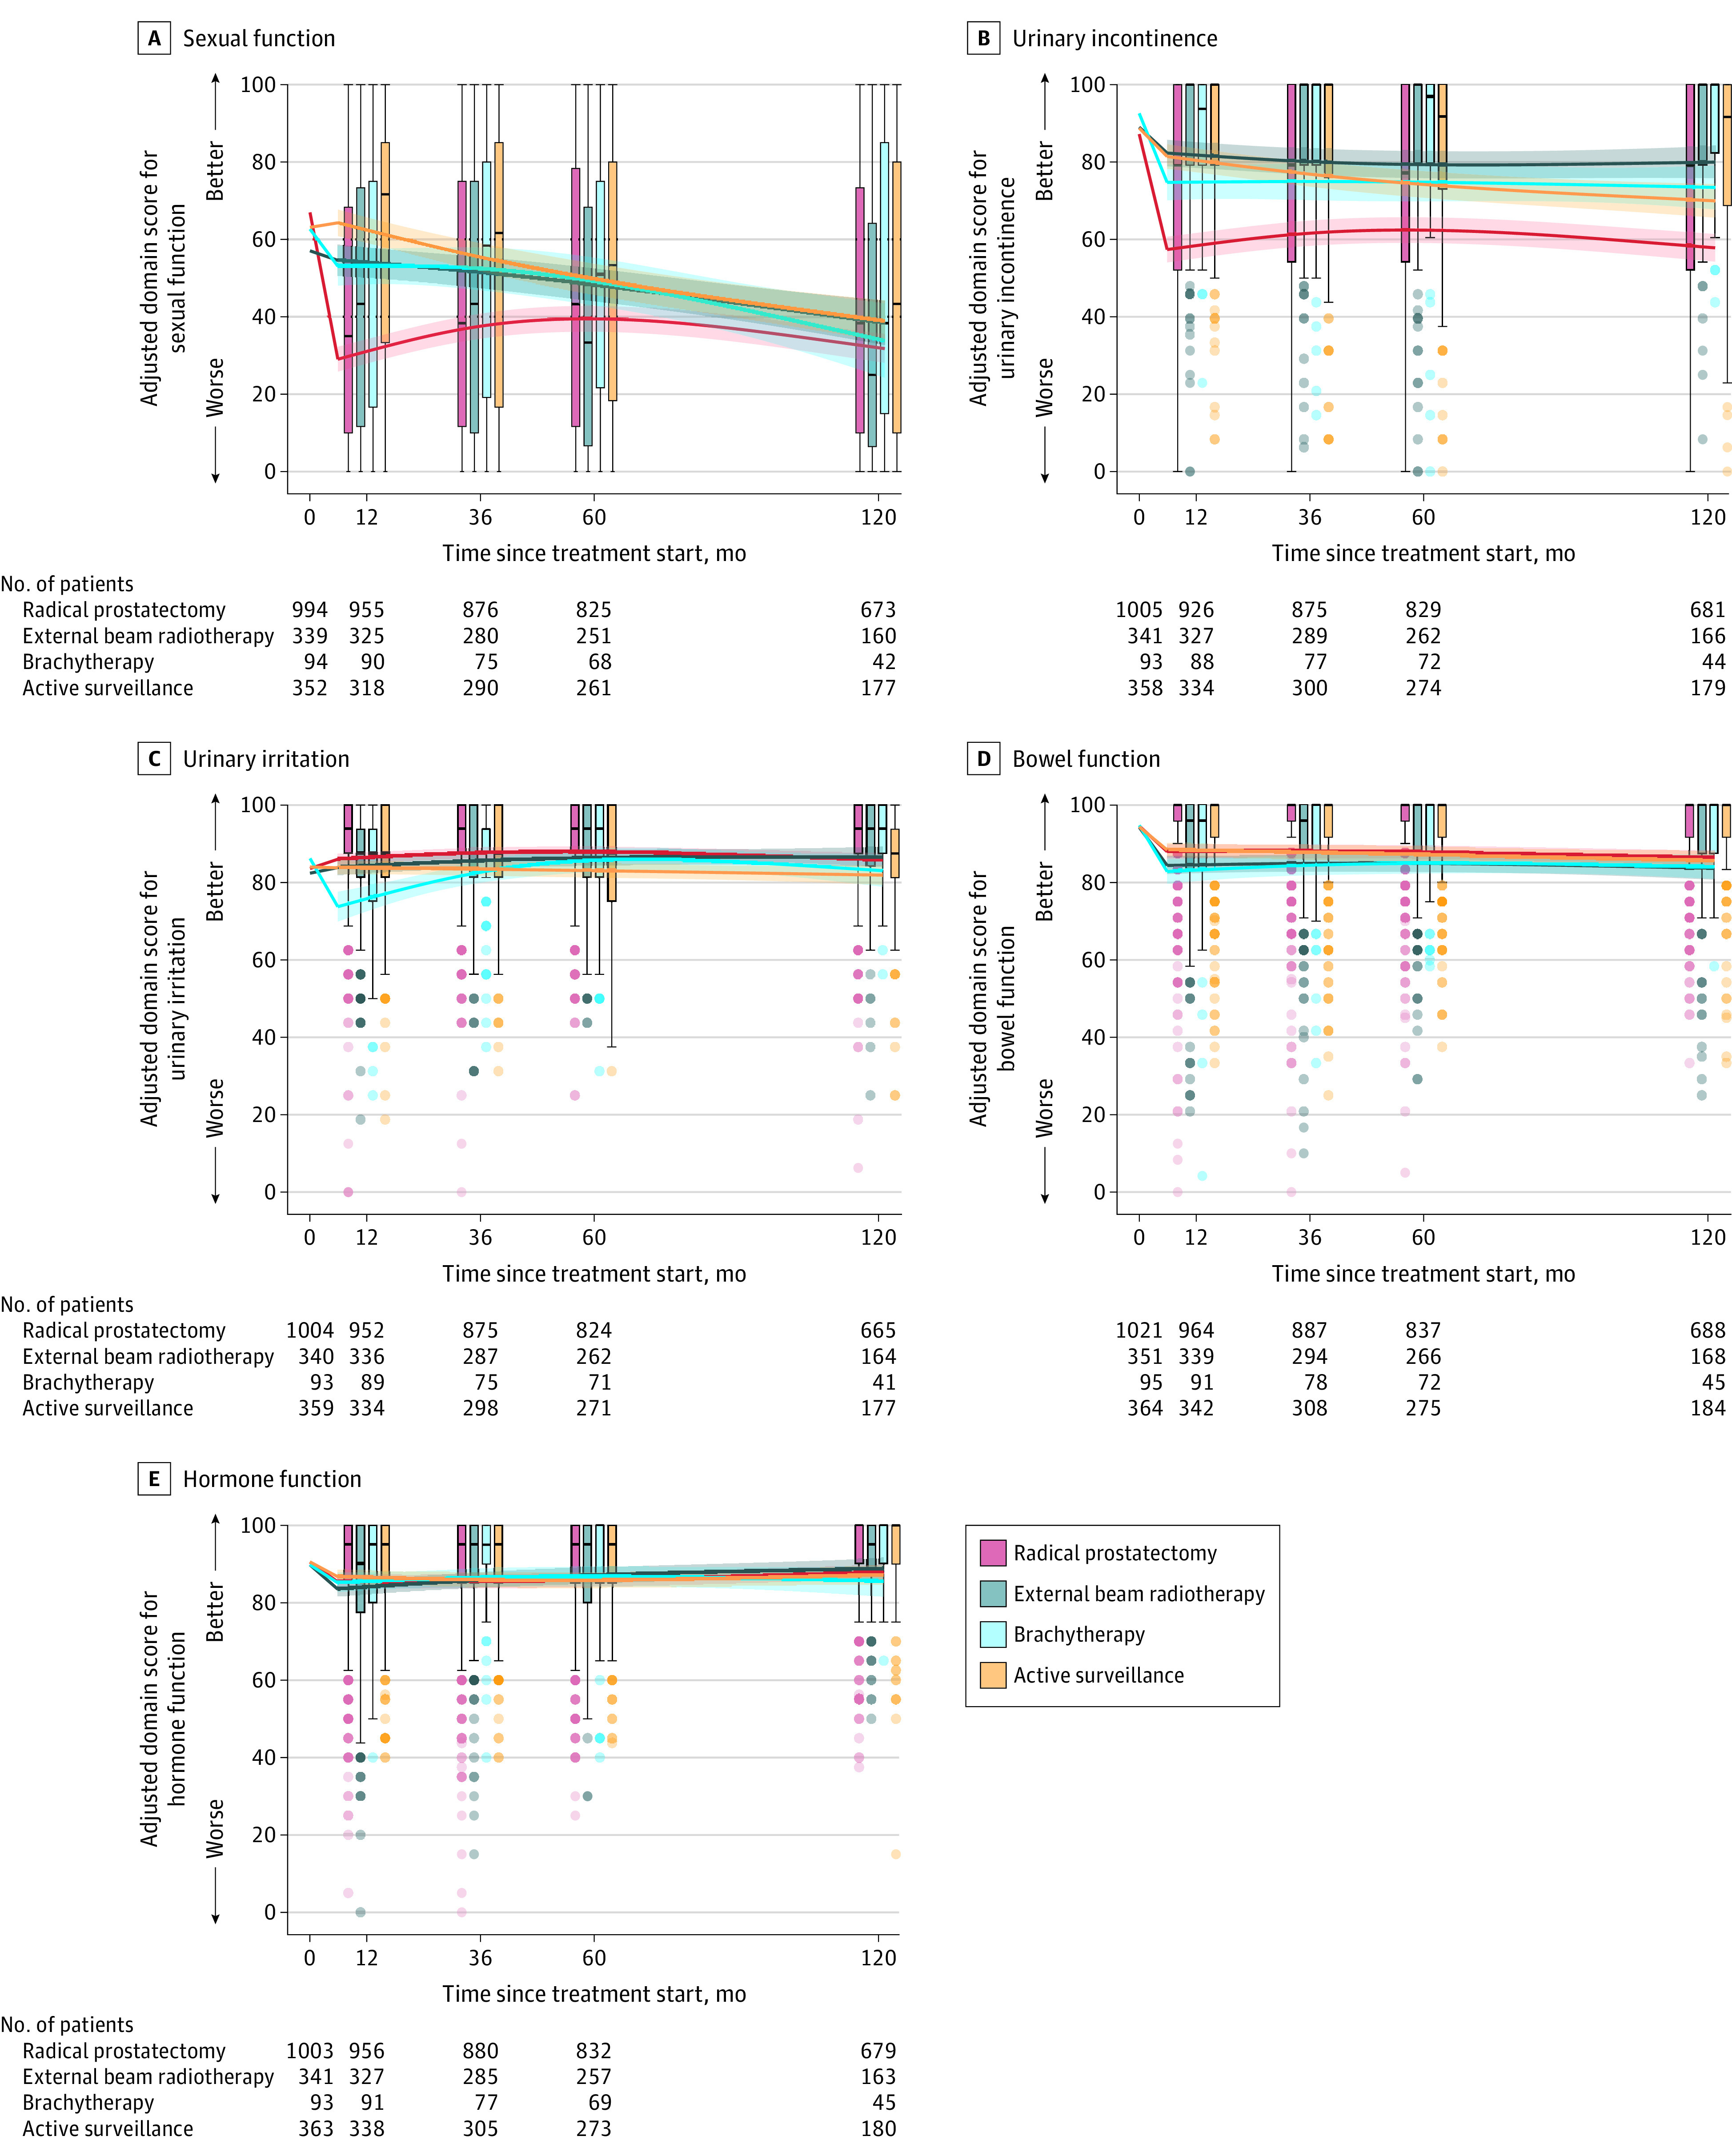
Figure 3. Sexual Function, Urinary Incontinence and Irritation, Bowel Function, and Hormone Function in Favorable-Prognosis PC Through 10 Years.

Box plots show unadjusted disease-specific function to 10 years. Crossbars are medians; boxes, IQRs; whiskers extend to the furthest points within 1.5 × IQR; dots, more extreme values with intensity signifying relative number of participants. Curves show adjusted mean EPIC-26 scores starting at unadjusted mean baseline for time zero. Regression models adjusted for baseline domain score, age, race and ethnicity, comorbidities, cancer characteristics, physical function, social support, depression, medical decision-making, and accrual site. Estimated domain scores used mean for continuous variables; mode for categorical variables. Scores and their interpretation are in the Methods. Hormone function assesses symptoms associated with hormone therapy adverse effects. eFigures 1 and 3 in Supplement 1 show more presentations.
