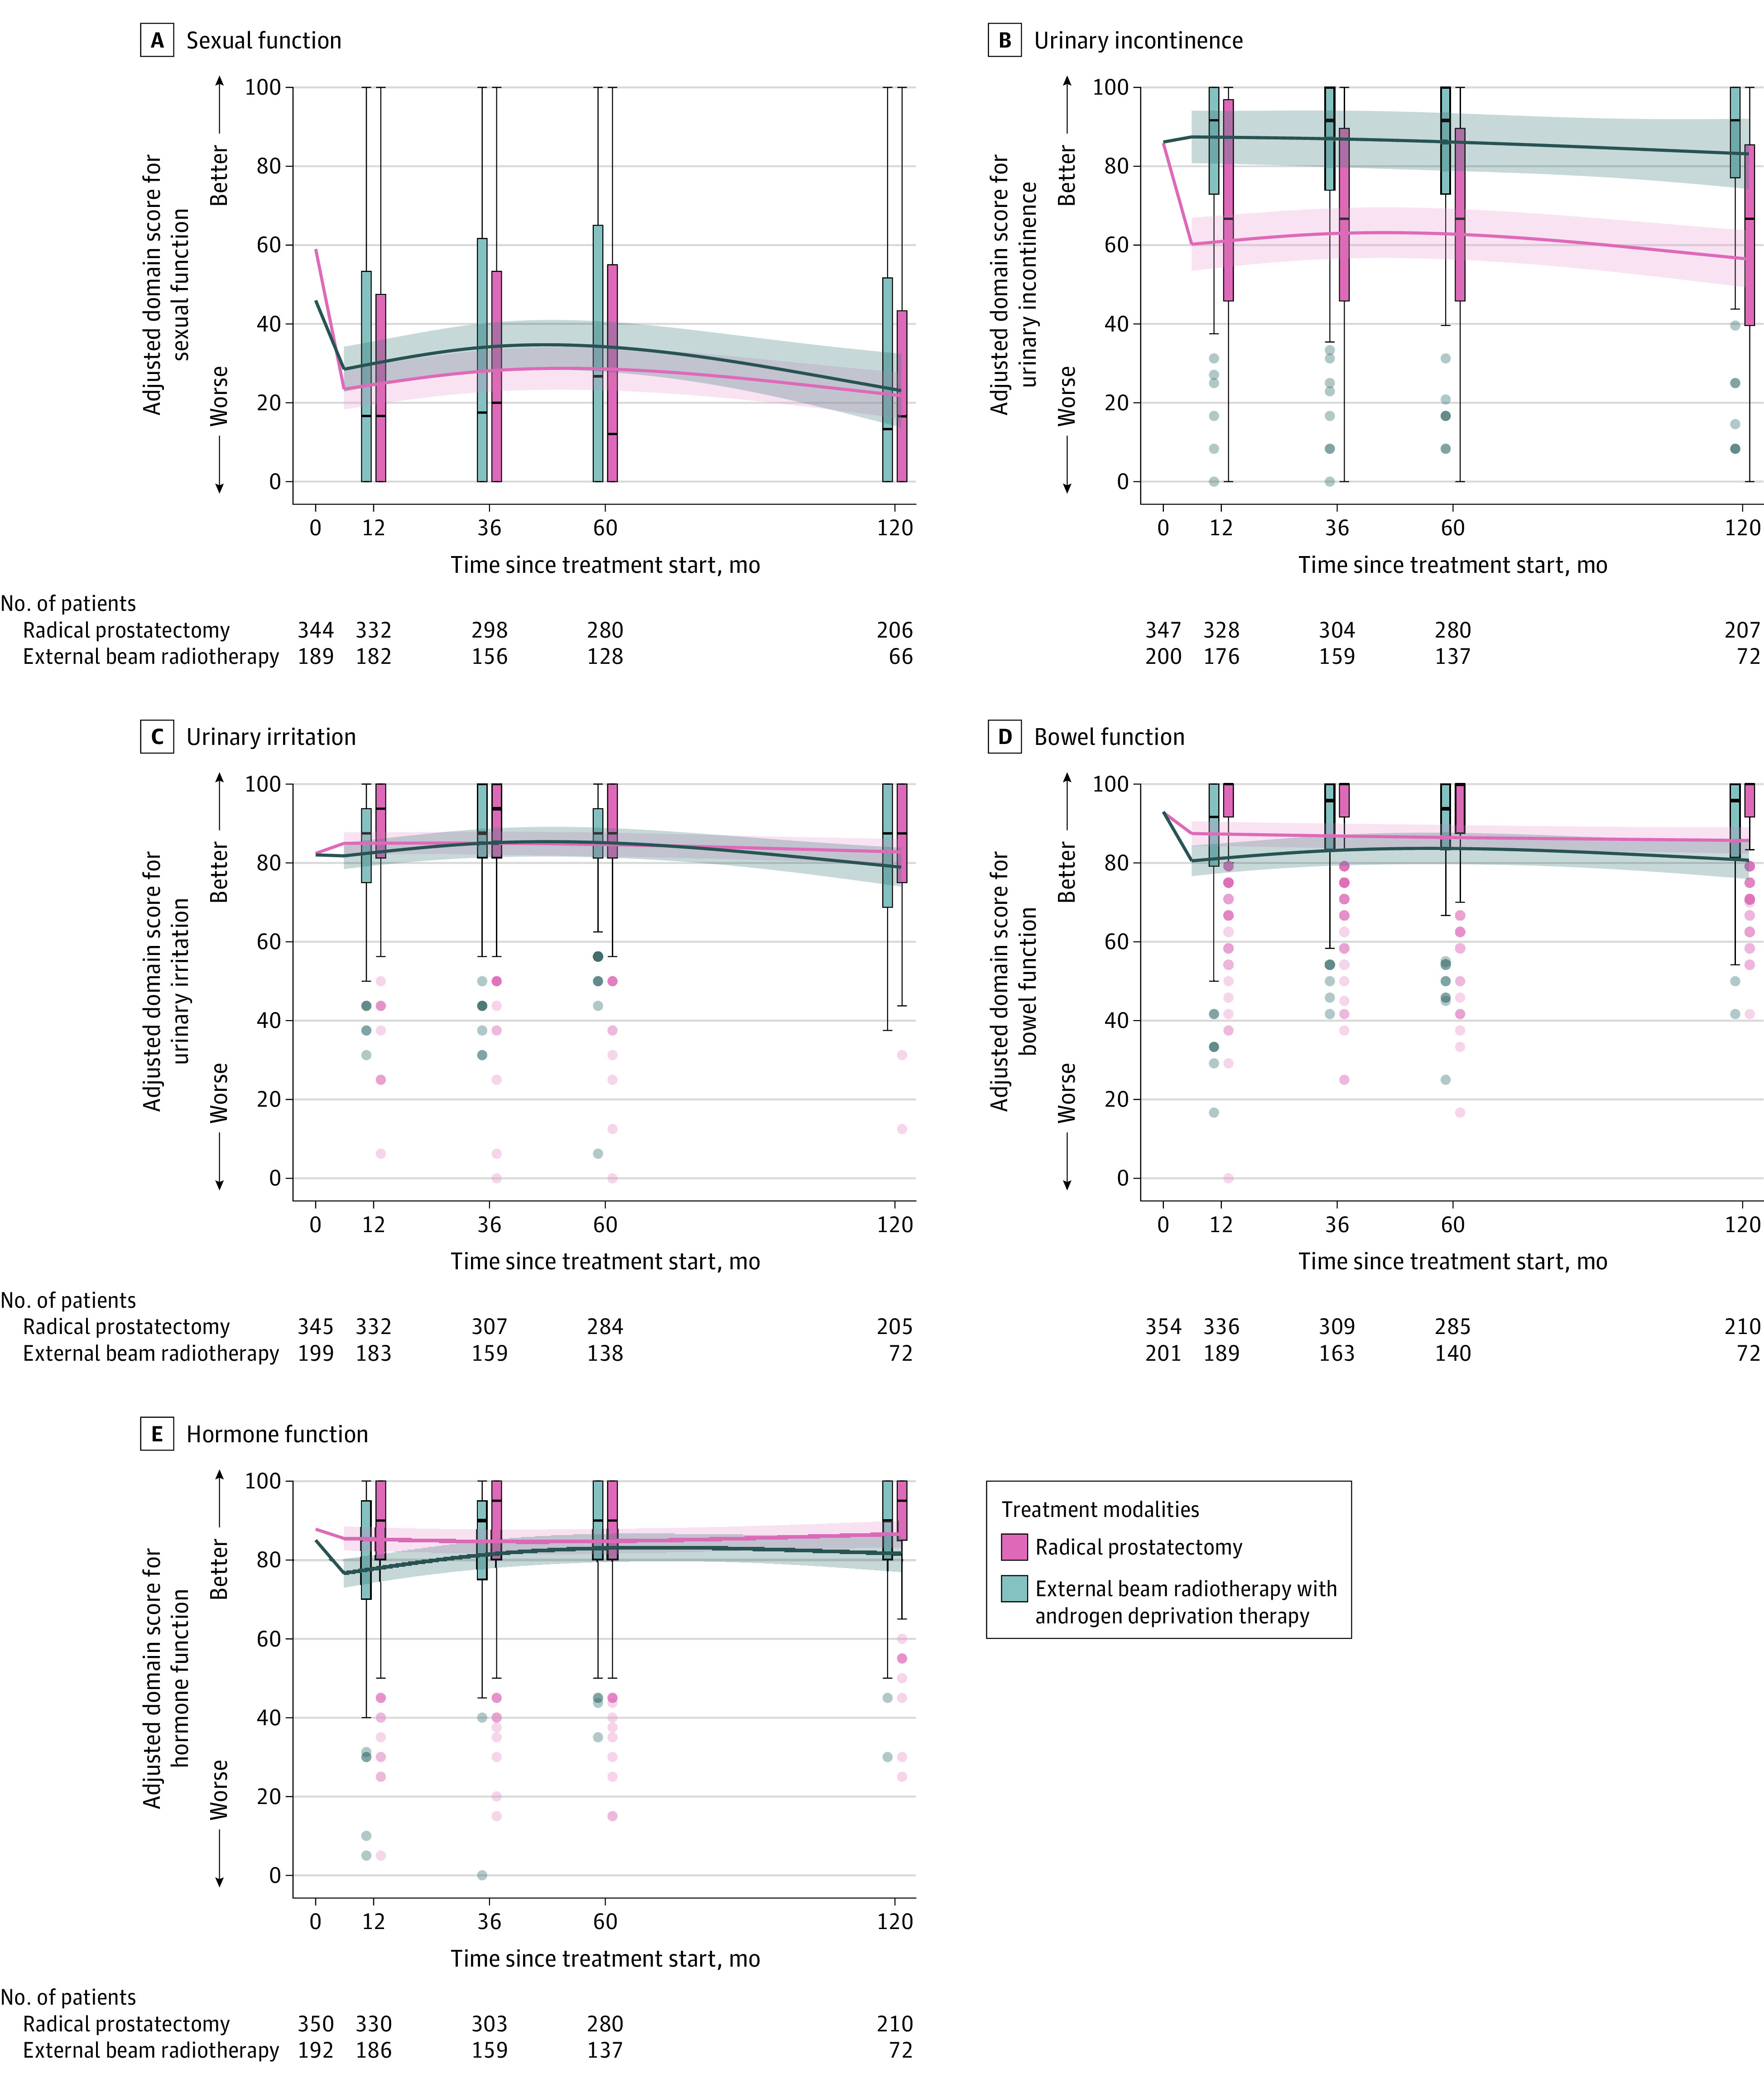
Figure 5. Sexual Function, Urinary Incontinence, Urinary Irritation, Bowel Function, and Hormone Function in Men With Unfavorable-Prognosis Prostate Cancer Through 10 Years.

Box plots demonstrate the distribution of unadjusted disease-specific function through 10 years. Crossbars represent medians; boxes, IQRs; whiskers extend to the furthest points within 1.5 × IQR; and more extreme values are shown as dots with intensity signifying the relative number of participants with that value. Curves demonstrate the adjusted-mean Expanded Prostate Cancer Index Composite functional domain scores starting at the unadjusted mean baseline score for time zero. Regression models were adjusted for baseline domain score, age, race and ethnicity, comorbidities, cancer characteristics, physical function, social support, depression, medical decision-making style, and accrual site. Estimated domain scores were calculated using mean for continuous variable and mode for categorical variables. Scores and their interpretation are in the Methods. Shading represents 95% CIs. Hormone function assesses symptoms associated with hormone therapy adverse effects. See eFigure 2 for presentation as radar plots and eFigure 4 for differences between treatments in Supplement 1.
