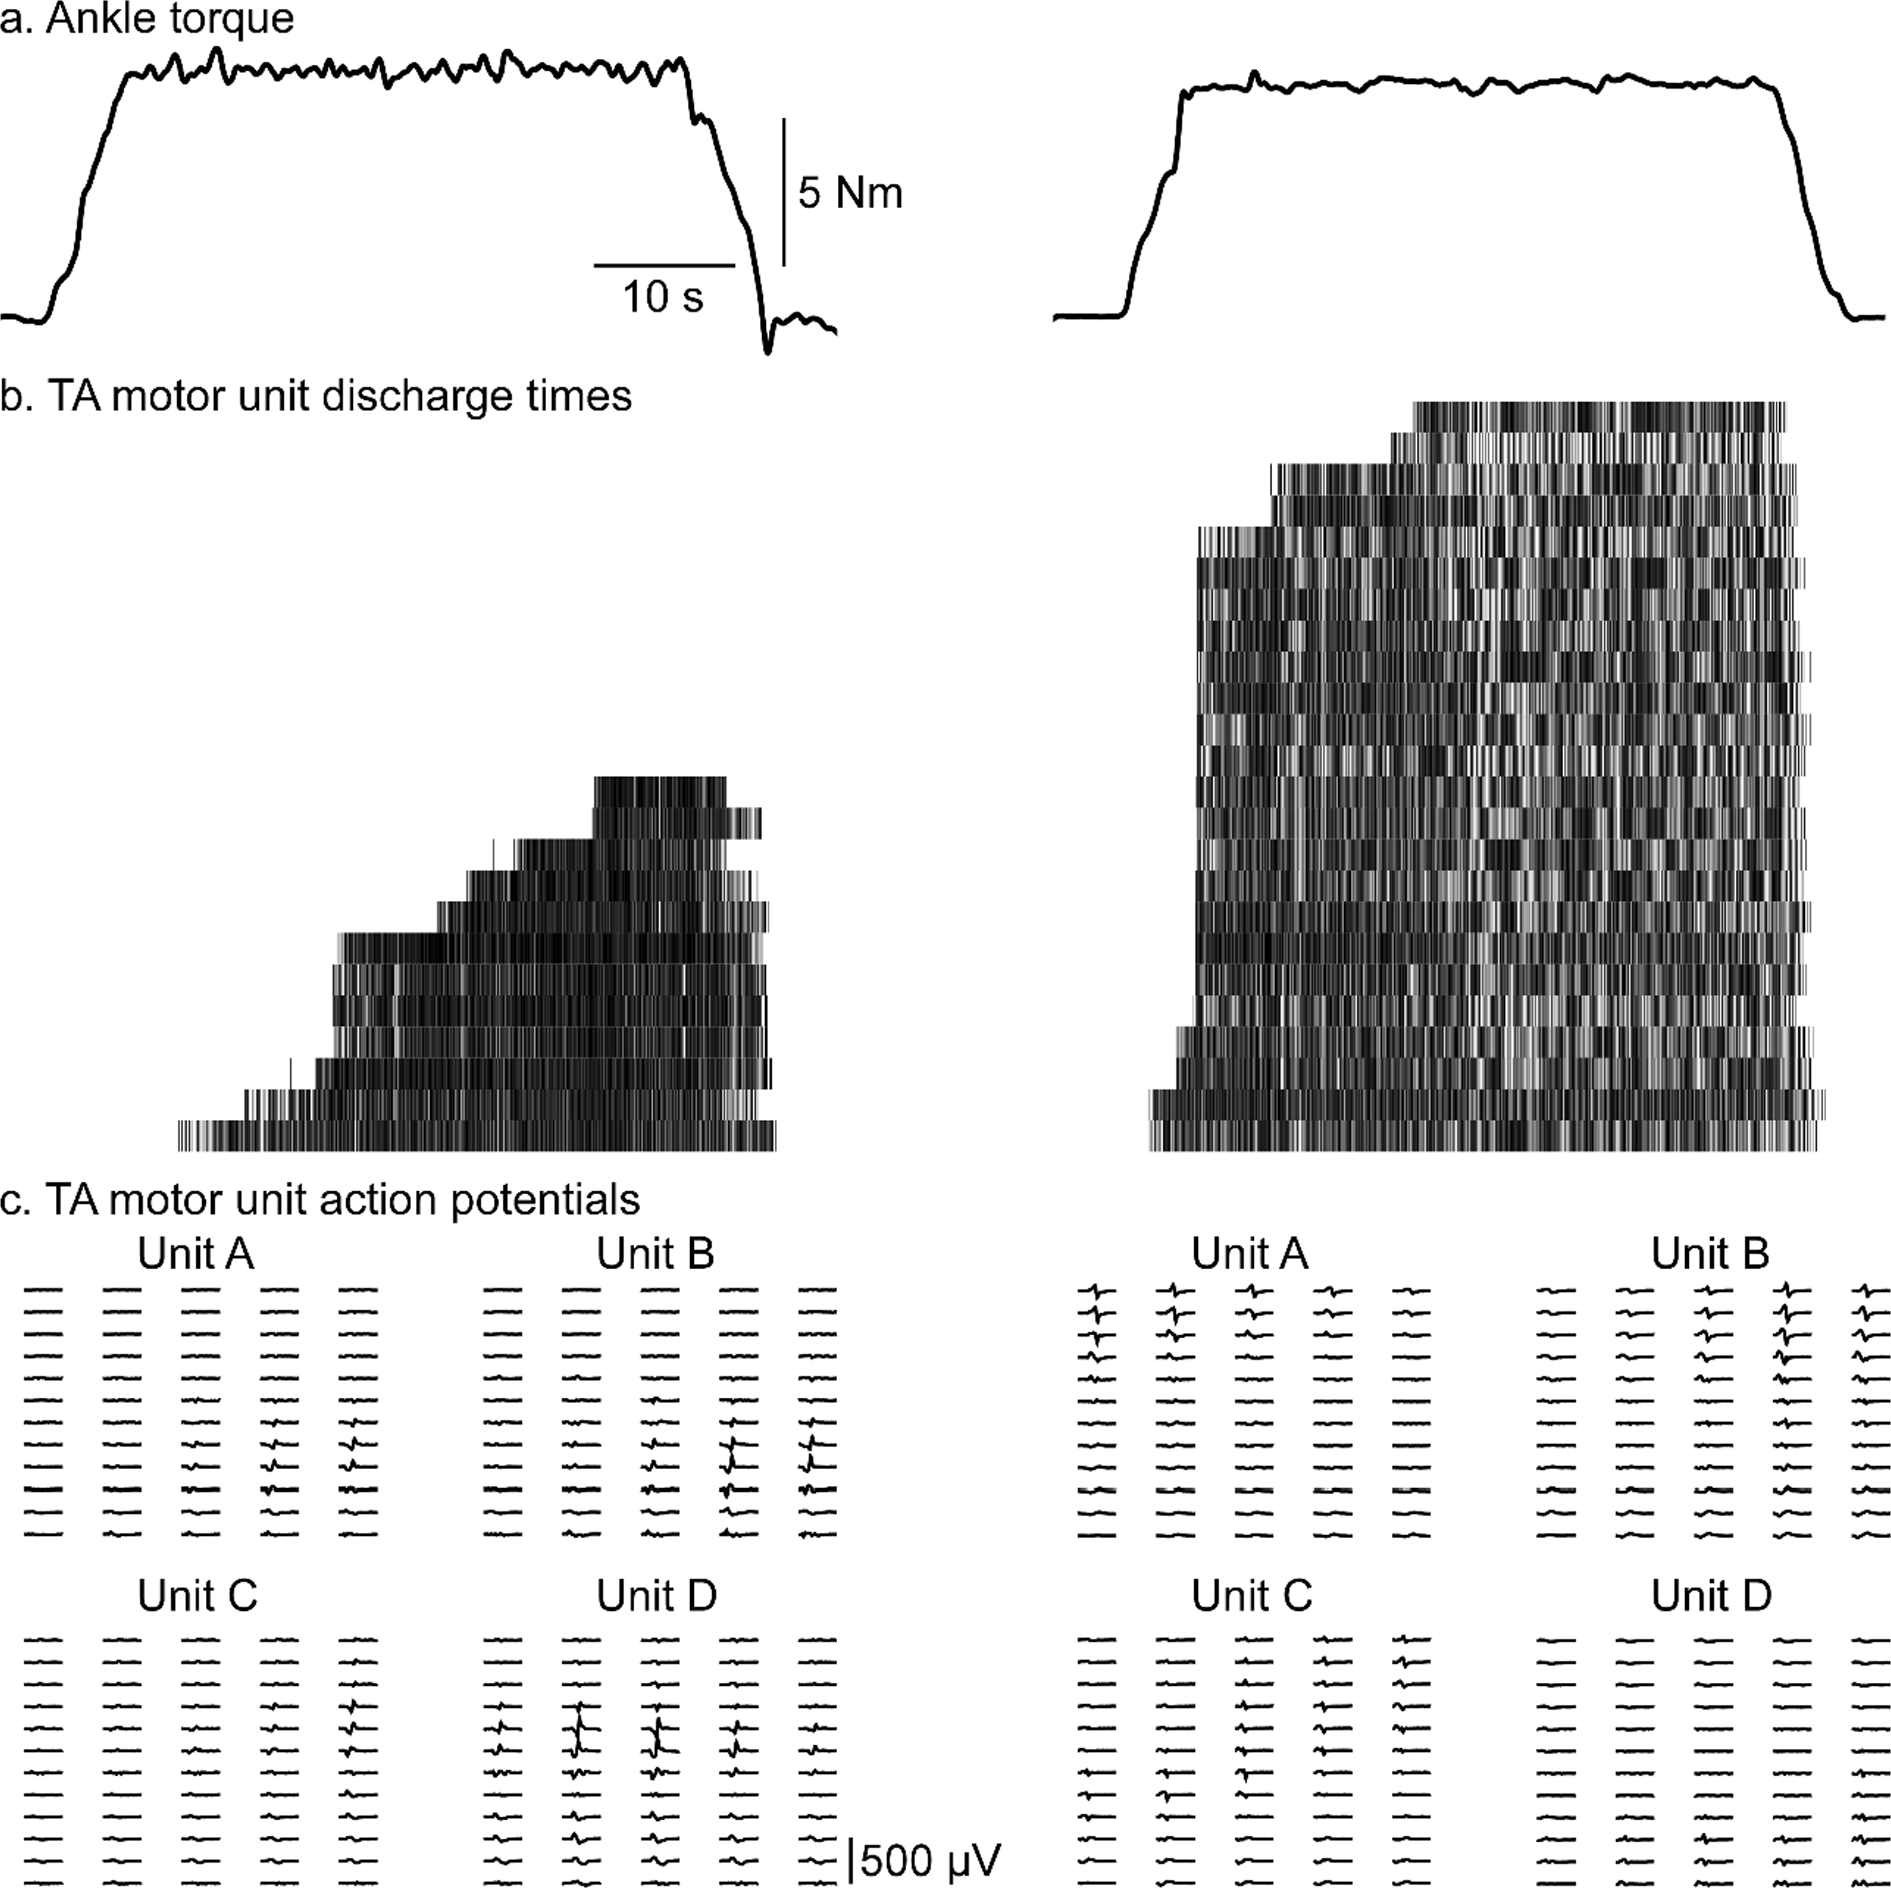
Fig. 1. Raw data.

Data of two subjects (left female and right male) during 20% MVIC submaximal hold contractions. Dorsiflexion torque (solid black line) during submaximal hold contraction (A). A raster plot of motor unit discharge, each row represents a unique motor unit with each hashmark representing the discharge of that unit (B). Representative motor unit action potential wave forms are displayed in the bottom section (C).
