
Figure 1.
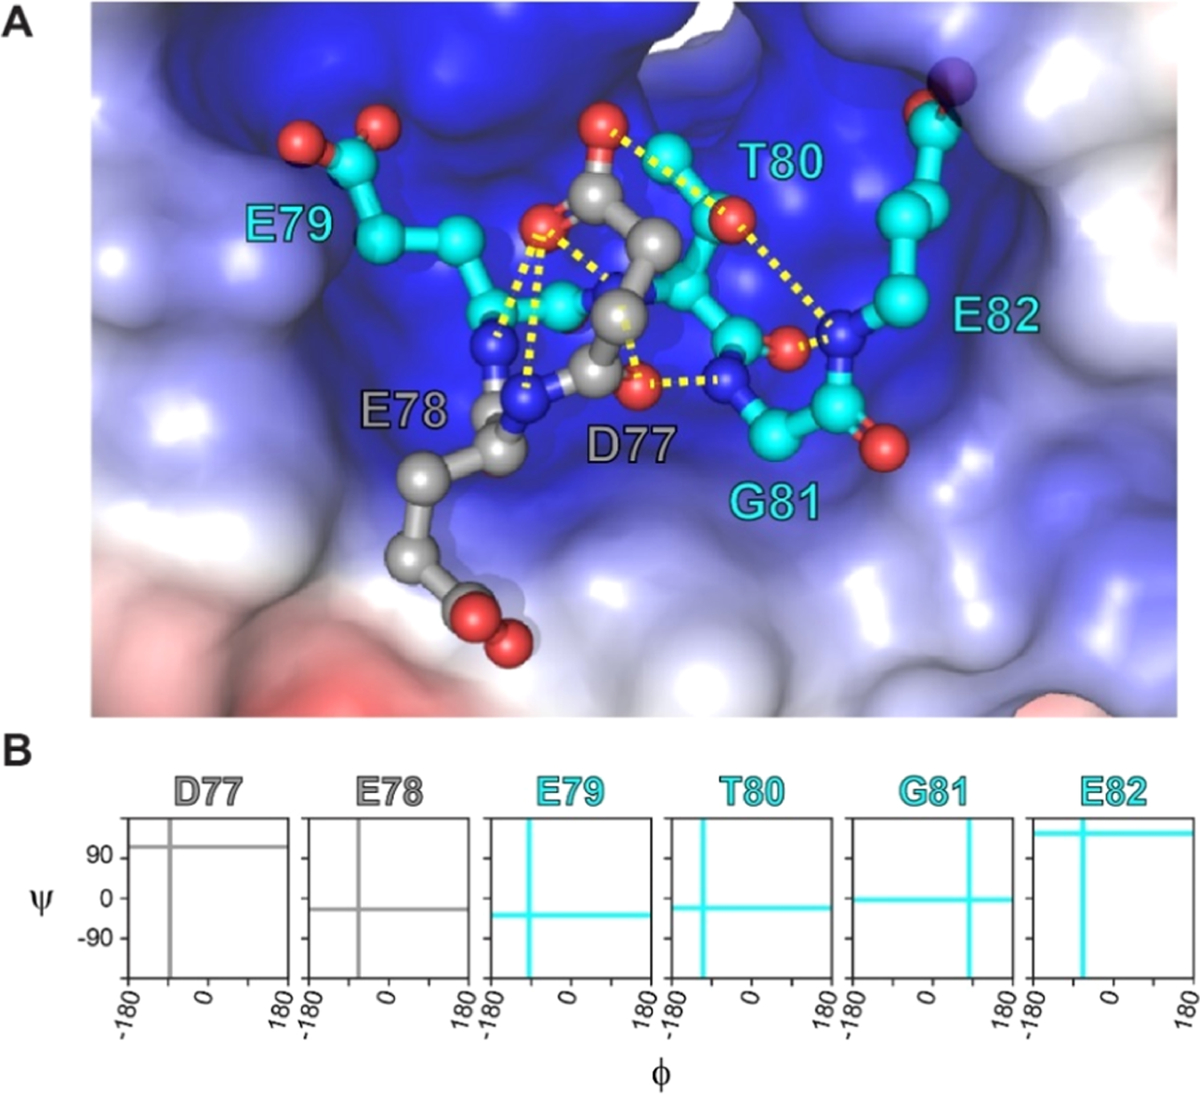
DEETGE loop of Nrf2 binds to Keap1. (A) Three-dimensional visualization of the DEETGE motif of Nrf2 (gray and cyan balls and sticks) occupying the binding pocket of Keap1 (shown in the electrostatic potential surface; PDB 2FLU).24 Residues D77 and E78 are shown in gray, residues E79 to E82 are shown in cyan, and key intramolecular hydrogen bonds are shown as yellow dotted lines. (B) Backbone torsional angles of the DEETGE epitope bound to Nrf2. Cyan lines indicate the (Φ, Ψ) values in the desired conformation for the residues in the core binding sequence ETGE. Gray lines indicate the (Φ, Ψ) values in the desired conformations for D77 and E78.