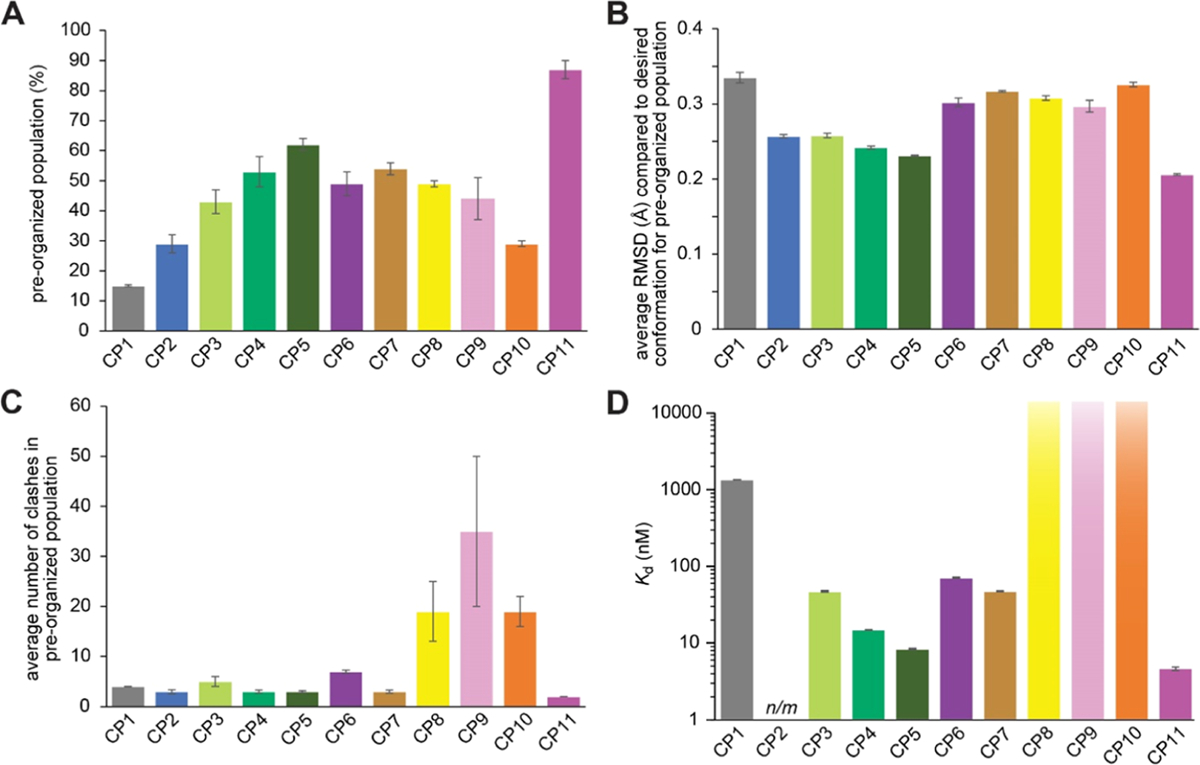
Figure 4.

Summary of results from simulations (A–C) and experimental affinity measurements (D). (A) Percentage of each ensemble which has a backbone RMSD of less than 0.5 Å compared to the desired ETGE conformation (preorganized population). (B) Average backbone RMSD compared to the desired ETGE conformation for the preorganized population. (C) Average number of clashes in the preorganized population, defined as the average number of atoms with van der Waals radii that overlap with atoms of Keap1 when each frame is overlaid with the desired ETGE conformation within the Keap1 binding pockets. Error bars for computationally derived values represent the standard error of the mean from two independent simulations using different starting conformations. (D) Binding affinity of each CP, experimentally measured by biolayer interferometry. Error bars for the Kd values represent the standard error of the mean from three independent trials. CP8, CP9, and CP10 showed no detectable binding at concentrations as high as 15 μM. n/m refers to measurements that were not made due to poor synthesis yields.
