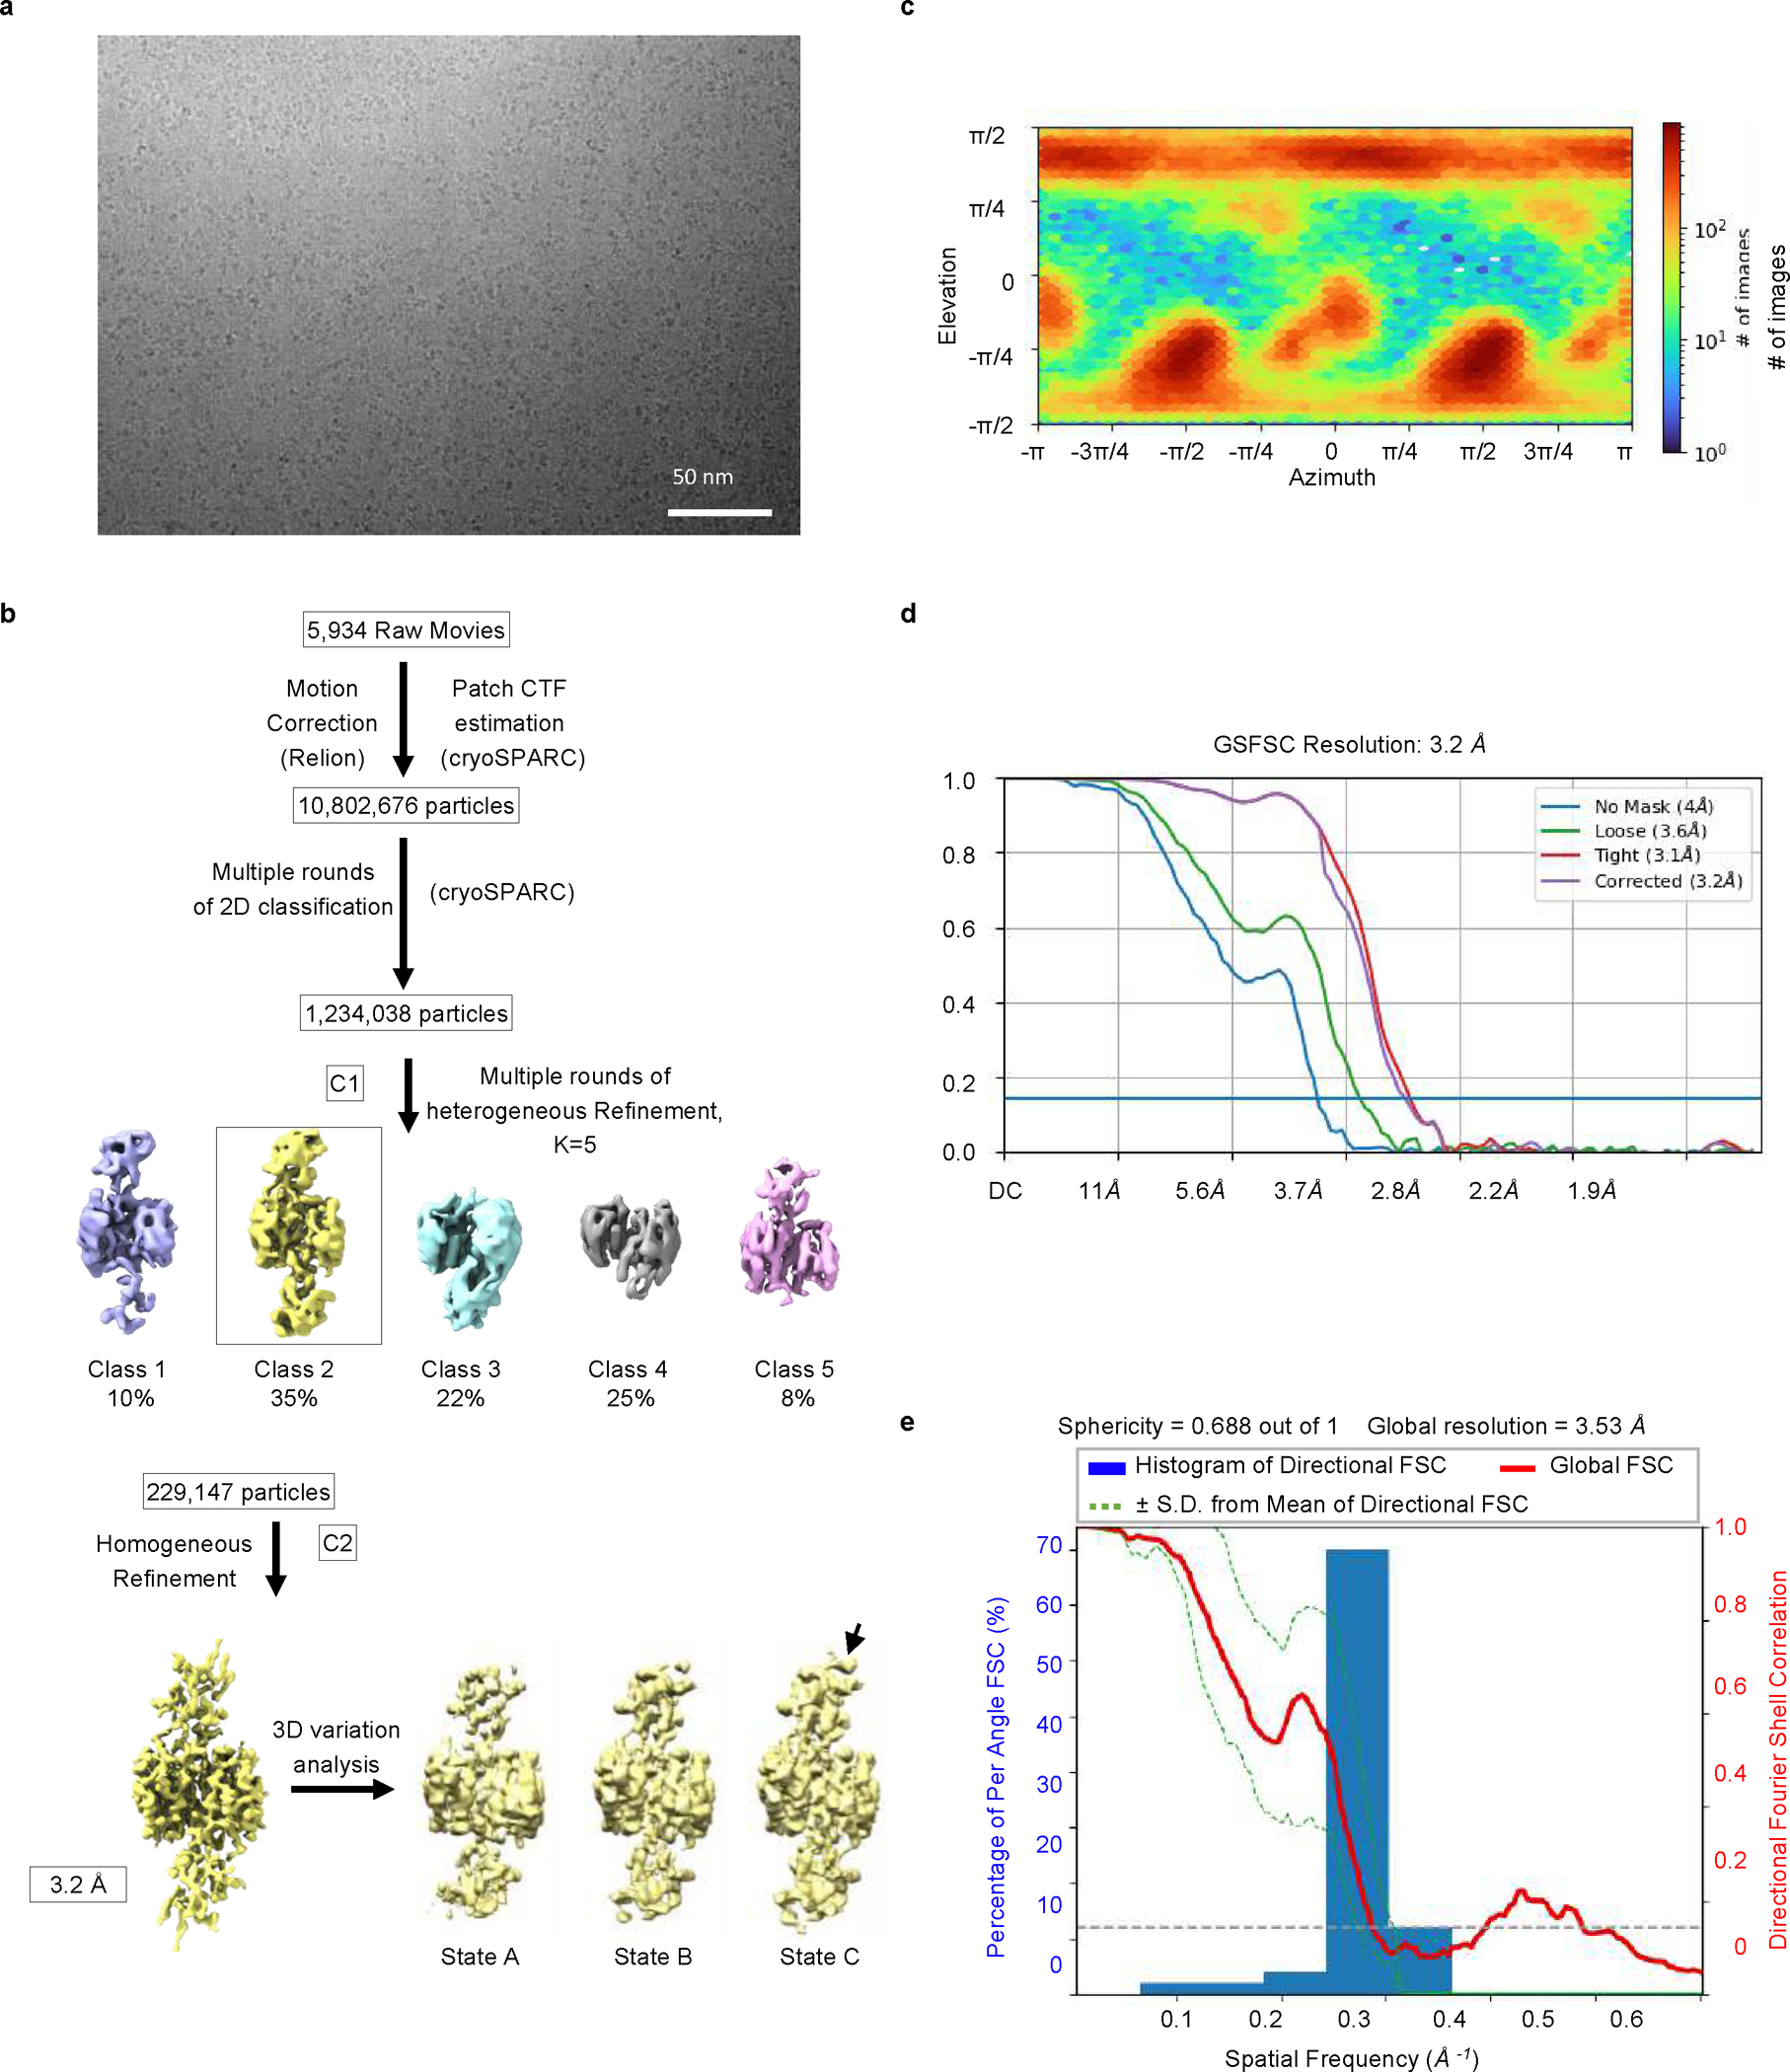
Extended Data Fig. 5 |. Cryo-EM data processing for the caspase-4/pro-IL-18 complex.

a, Cryo-EM raw image (representative of two data collections). b, Cryo-EM data processing flow chart. The black arrow pointing to “State C” shows domain flexibility indicated by 3D variability analysis. c, Heat map for the orientation of particles used for the final reconstruction. d, Fourier shell correlation (FSC) plots. e, 3D FSC plot.
