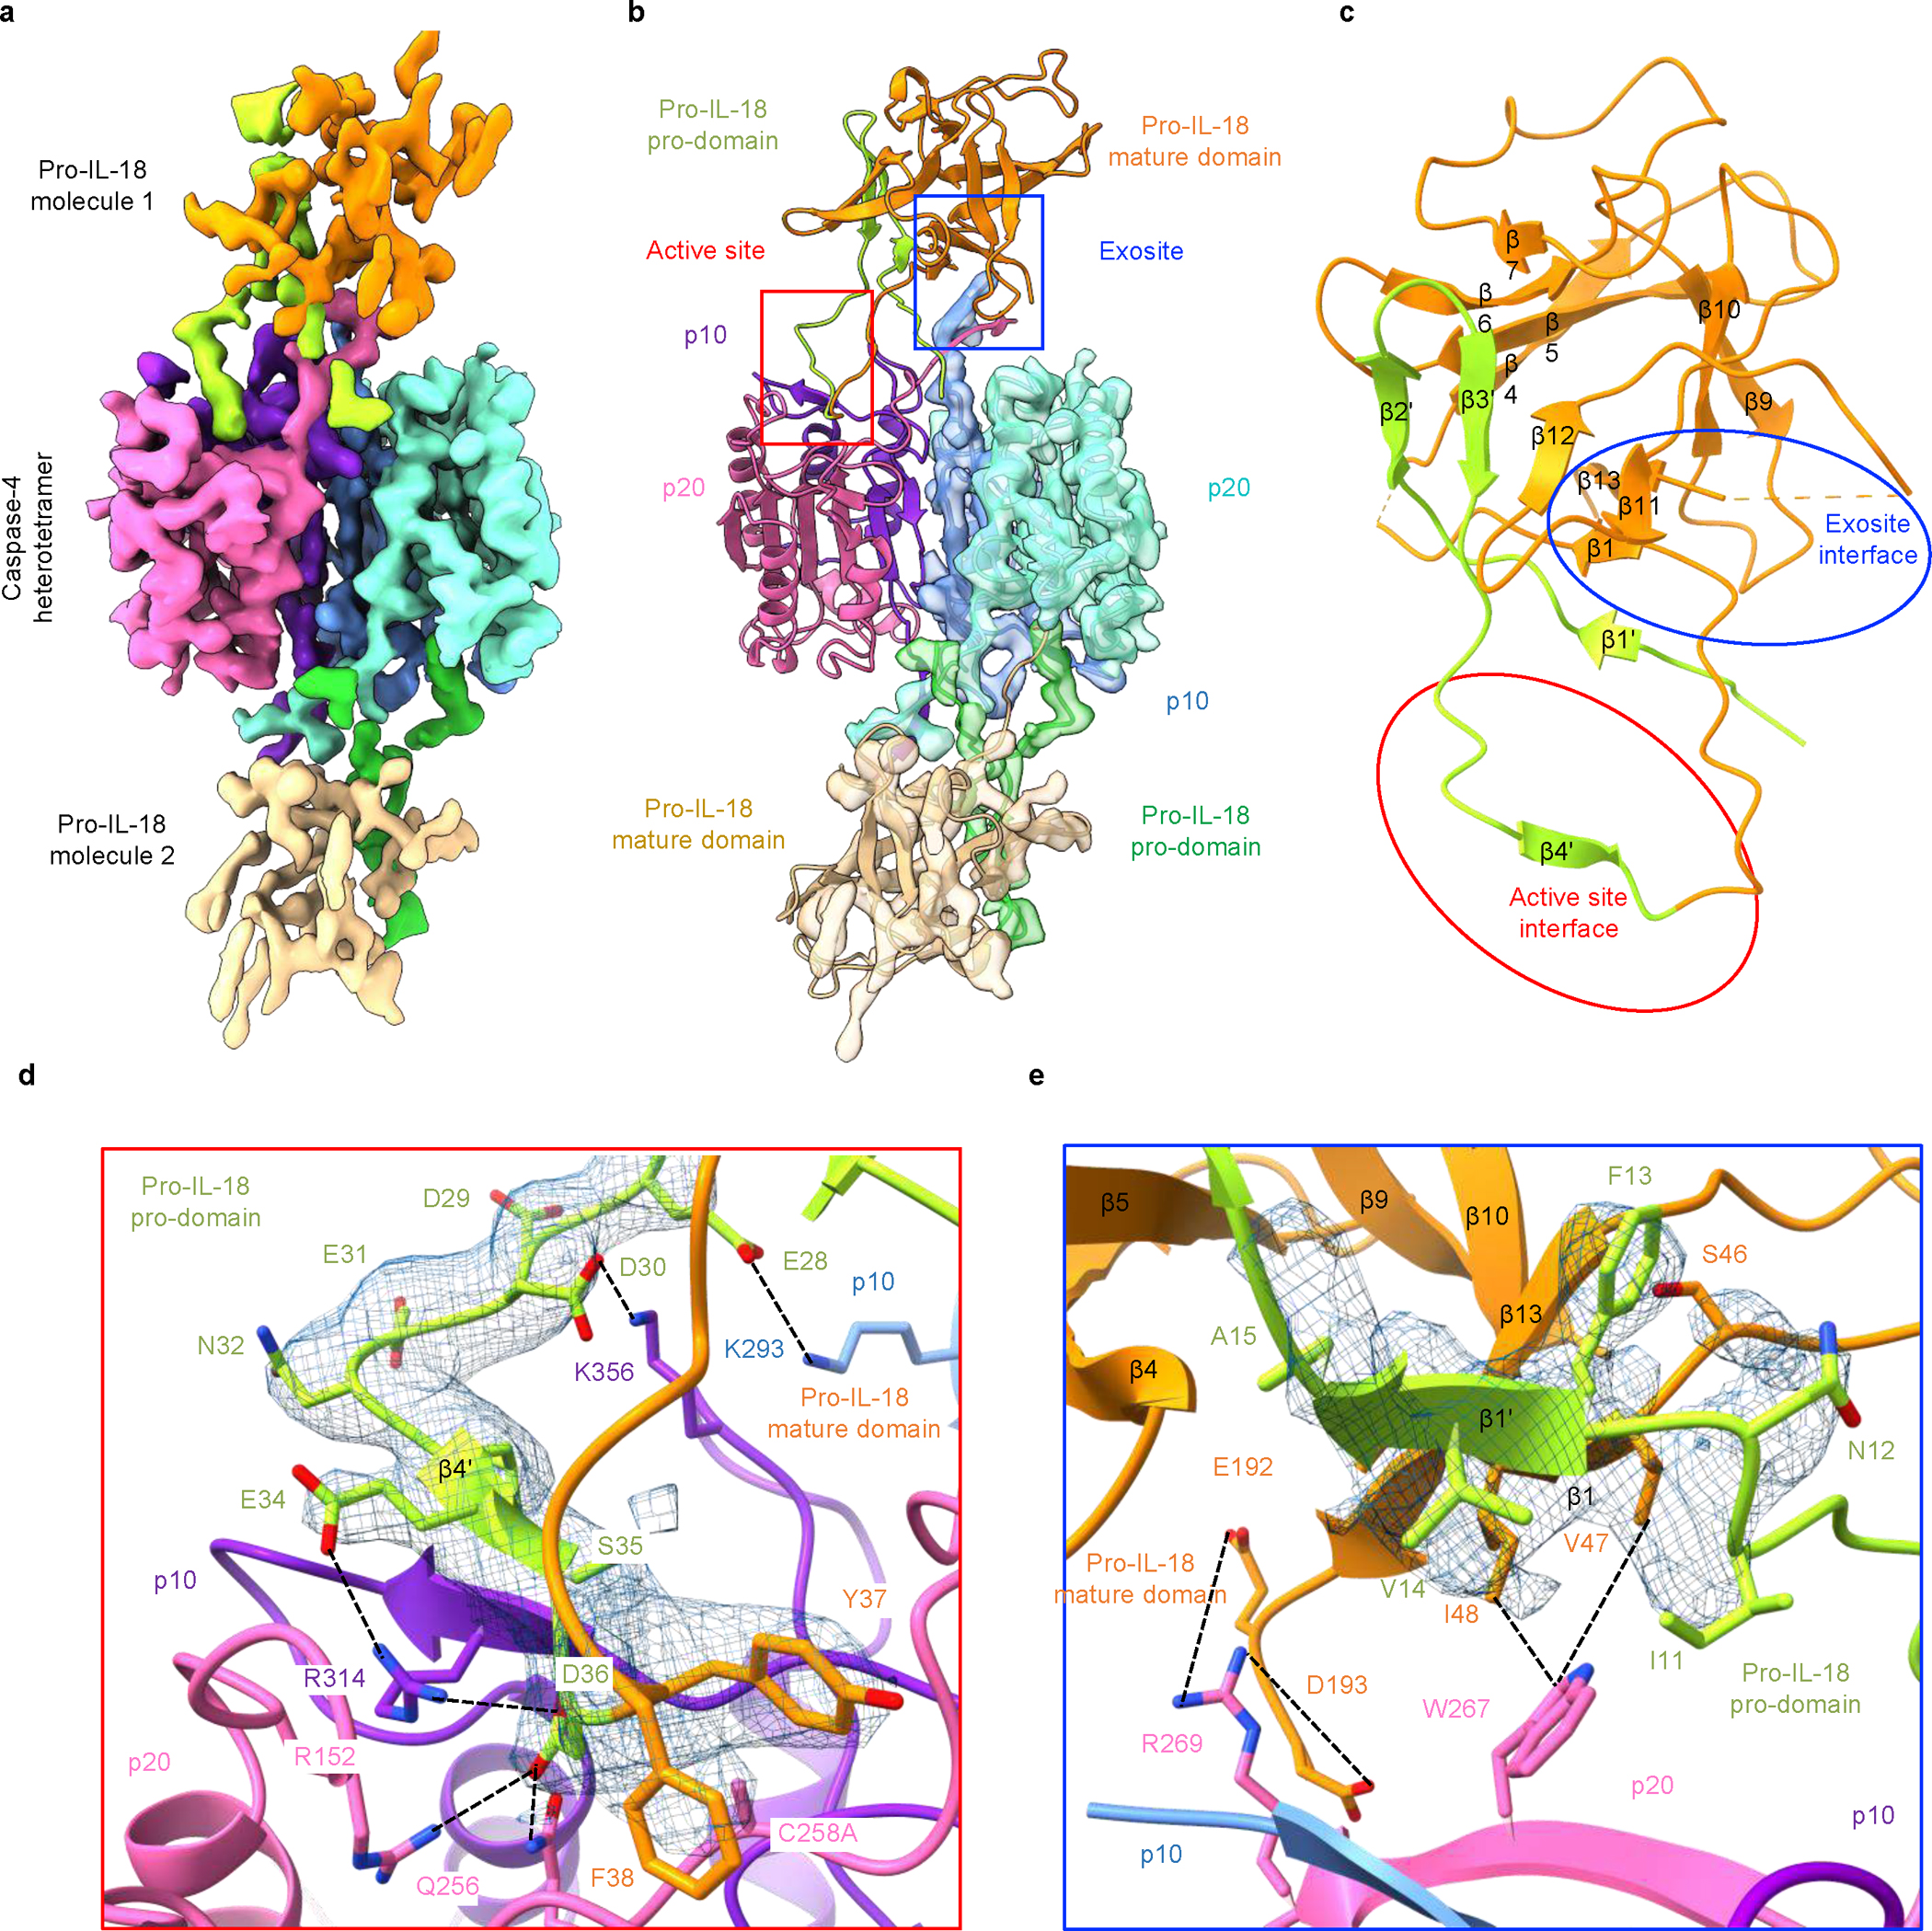
Fig. 3 |. Cryo-EM map and model of the caspase-4/pro-IL-18 complex.

a, Cryo-EM map of the caspase-4/pro-IL-18 complex coloured by domains (contour level: 3.0 σ). b, The caspase-4/pro-IL-18 complex model shown in the colour code as in (a), alone for one half, and superimposed with the cryo-EM map for the other half. Active site and exosite are enclosed in squares of red and blue, respectively. c, Pro-IL-18 structure with secondary structures labelled and the two interfaces enclosed in red and blue ovals. d, Detailed interaction interface at the active site. e, Detailed interaction interface at the exosite. The cryo-EM density for the relevant pro-IL-18 region is shown in blue mesh in (d) and (e).
