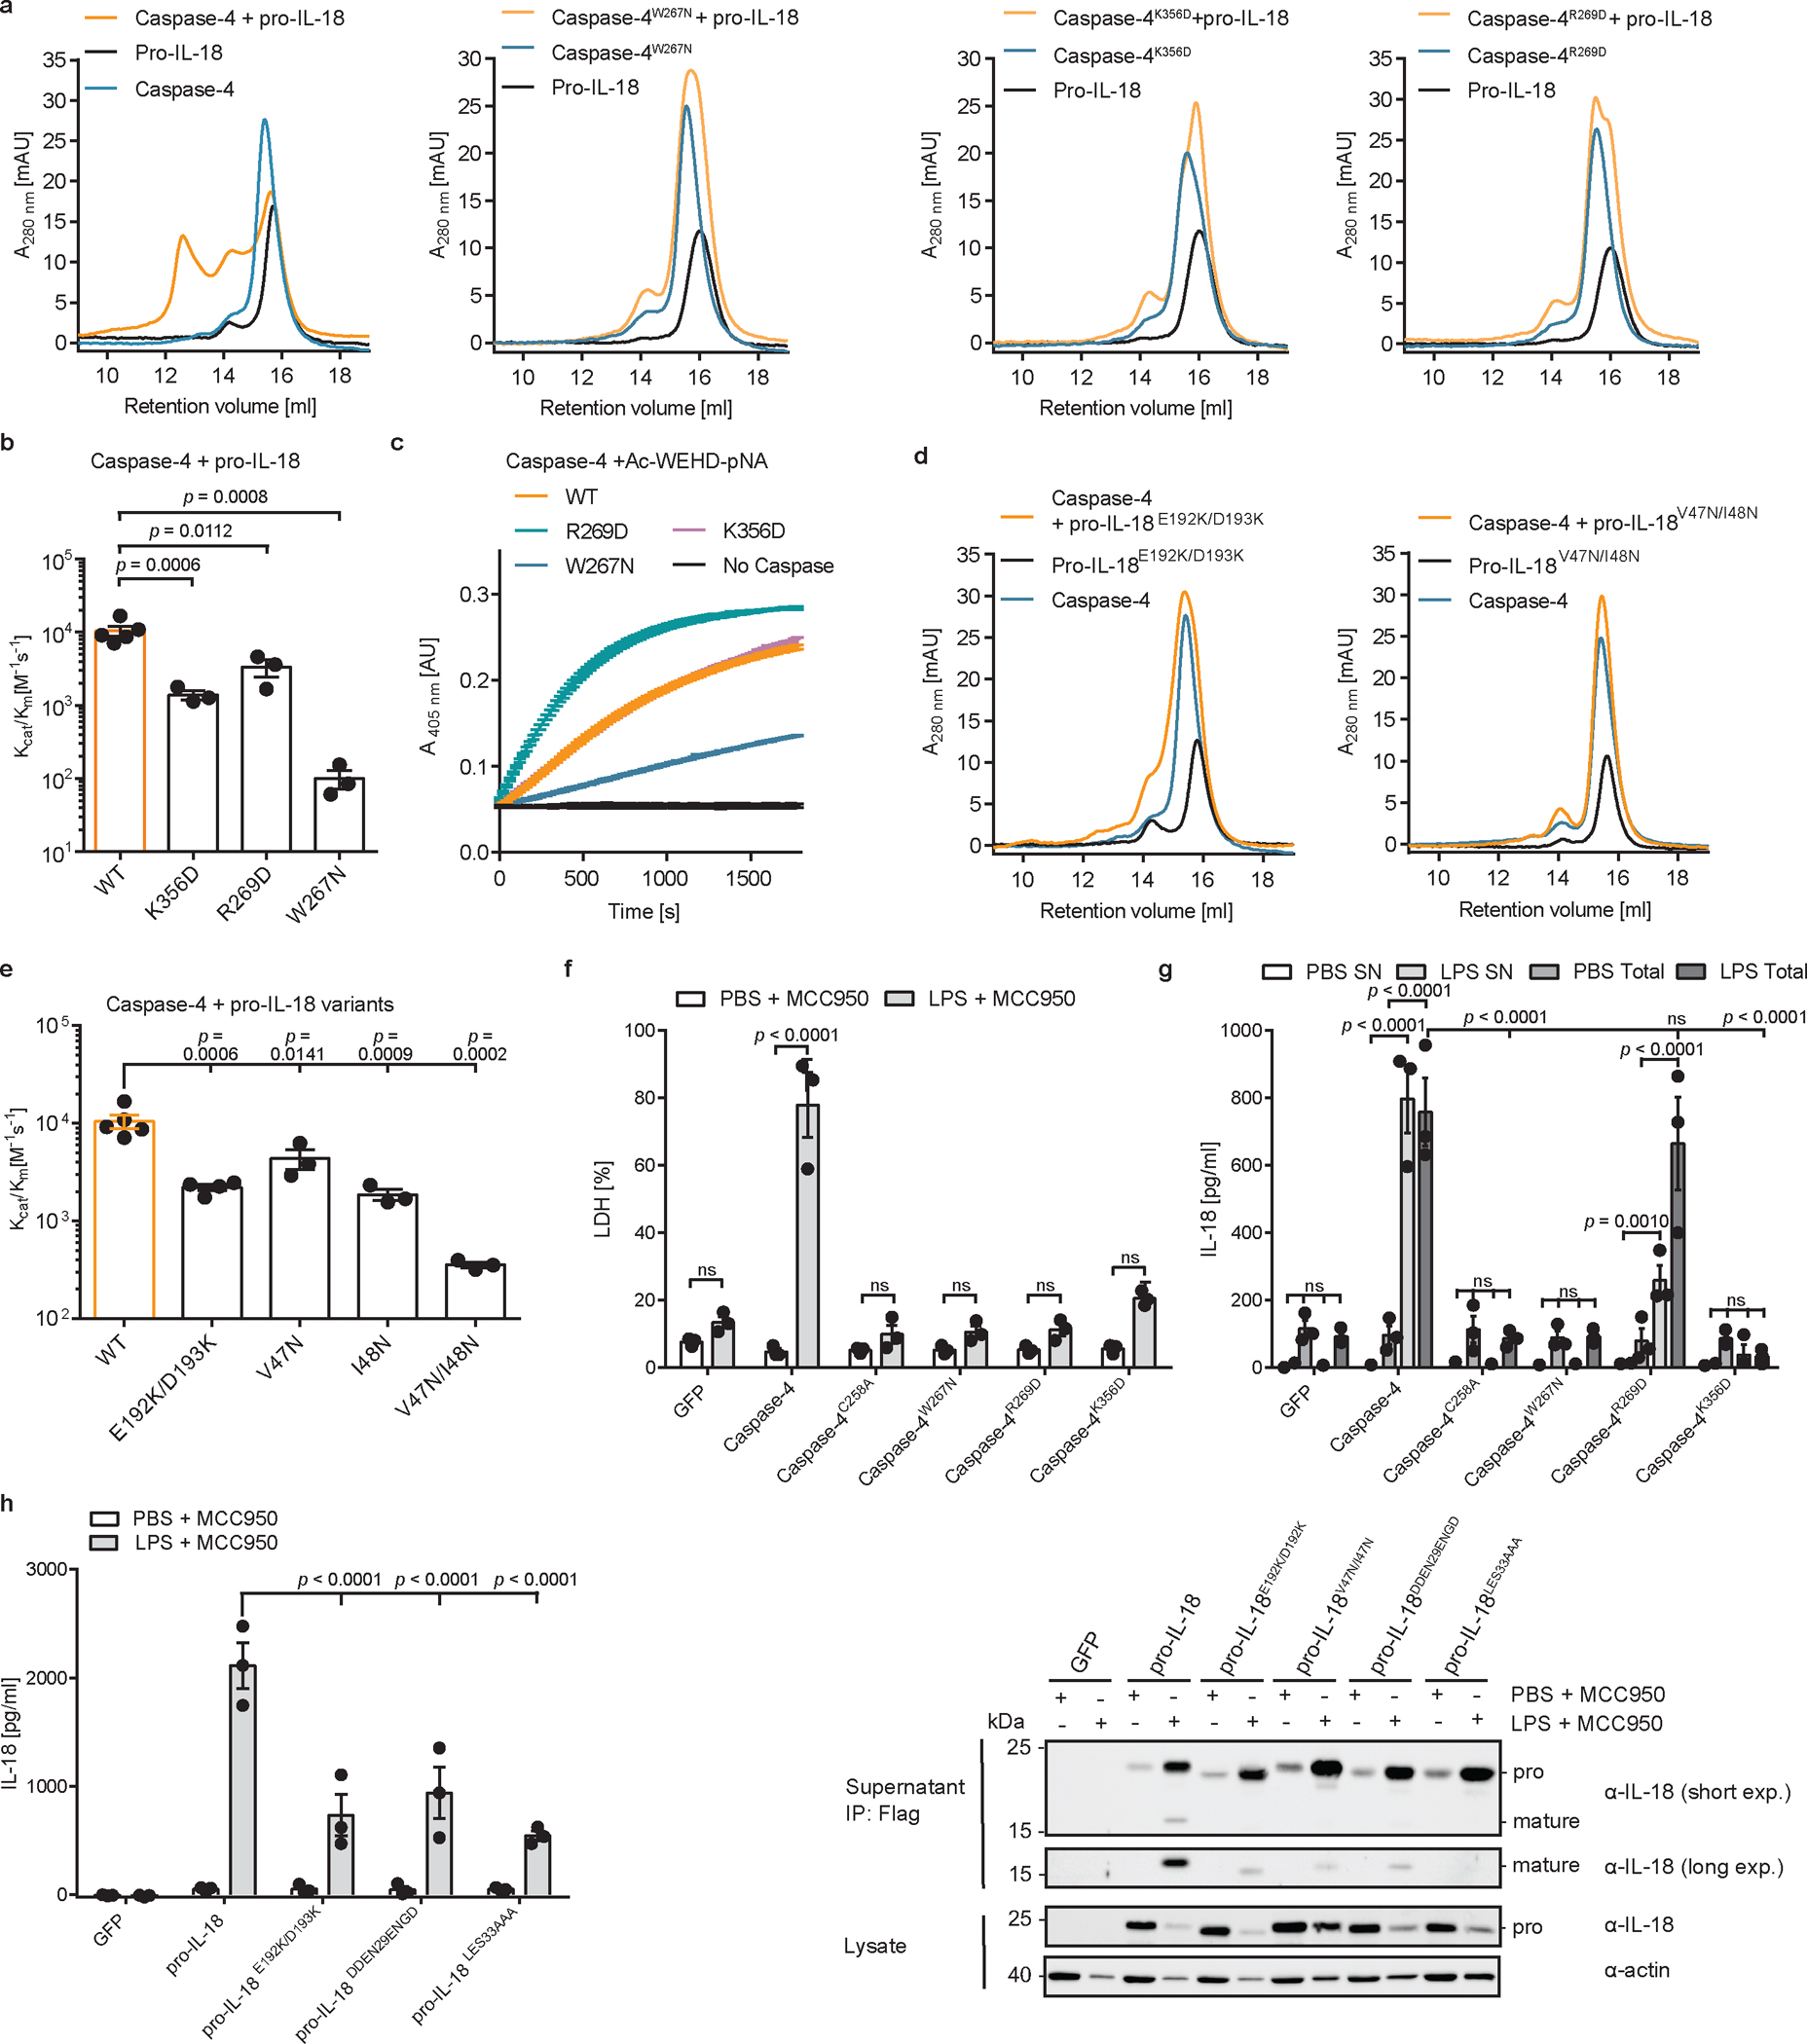
Fig. 5 |. A hydrophobic exosite is required for recognition and cleavage of pro-IL-18 by caspase-4.

a, Analytical SEC investigating complex formation between pro-IL-18 (produced in insect cells) and indicated caspase-4 p20/p10 mutants. b, In vitro cleavage of human pro-IL-18 by caspase-4 mutants. c, Kinetic analysis of cleavage of chromogenic peptide substrate Ac-WEHD-pNA by caspase-4 mutants. Curves show mean ± SD of two technical replicates and are representative of three biological replicates. d, Analytical SEC investigating complex formation between caspase-4 p20/p10 and indicated pro-IL-18 mutants. Pro-IL-18 mutants were produced in E. coli. e, In vitro cleavage of human pro-IL-18 mutants by human caspase-4. f, g, Caspase-4-deficient THP1 macrophages expressing caspase-4 variants were primed with LPS and electroporated with LPS (or PBS) in the presence of MCC950 and LDH release was quantified after 2 h. IL-18 levels in the supernatants or total IL-18 (combined supernatants + cell lysates) were quantified by ELISA. h, I, IL-18-deficient THP1 macrophages expressing pro-IL-18 variants were primed with LPS and electroporated with LPS (or PBS) in the presence of MCC950 and IL-18 levels in supernatants were quantified after 2 h. IL-18 was immunoprecipitated from supernatants using Flag-tag and analyzed by immunoblot. Immunoblots and SEC profiles are representative of three biological replicates. In b, and e, n=3 biological replicates for all substrate/enzyme pairs, except for WT caspase-4 + WT pro-IL-18 and pro-IL-18E192K/D193K, which are n=4. In f-h, n=3 biological replicates. Each data point represents the result of one independent assay. Bars and error bars represent mean ± SEM. Statistical significance was determined by one-way ANOVA (b, e) or two-way ANOVA (f, g, h) with Tukey’s multiple comparisons test: ns = not significant (p > 0.05). For gel source data, see Supplementary Figure 1.
