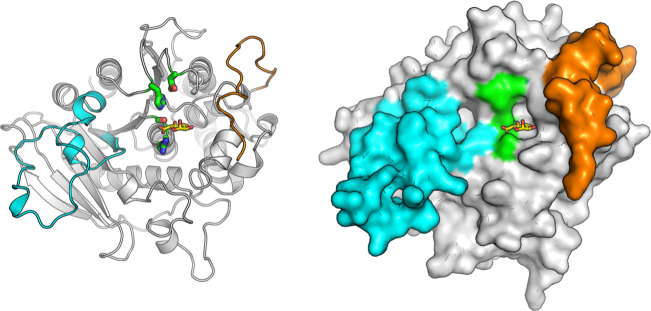
Fig 4.
Overall structure of PvCE15. A cartoon representation of PvCE15 (left, PDB accession: 8Q6S) in complex with GlcA, shown in yellow sticks, with the residues of the catalytic triad shown as green sticks and the regions corresponding to Reg2 and RegN shown in cyan and orange, respectively. A surface representation (right) illustrating the buildup of the binding cleft by Reg2 and RegN.

