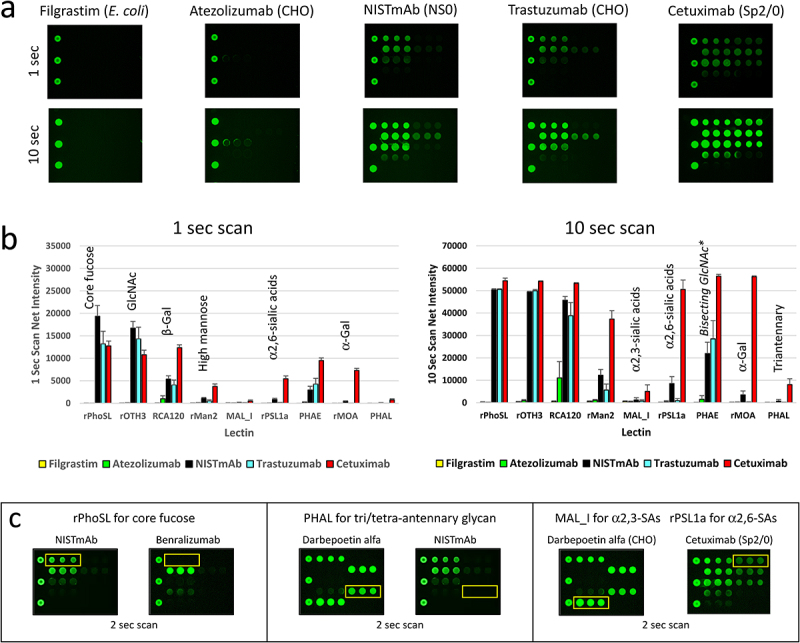
Figure 2.

Qualification of LecChip-IgG-mAb using model samples with known glycan profiles. Two non-glycosylated therapeutic proteins (filgrastim and IgG1 atezolizumab), along with three N-glycosylated IgG1 mAbs produced by different cell lines (NISTmAb, trastuzumab, and cetuximab) were subjected to testing using LecChip-IgG-mAb (see details in the materials and methods section). Representative raw images acquired at 1-second scan and 10-second scan are shown (a). The LecChip binding signals (b) were used to determine the relative abundance of individual N-glycan epitopes based on the known selectivity of each lectin (table 1). The error bars represent standard deviation (n = 3) derived from three independent experiments.*PHAE signal should only be used to evaluate samples containing predominantly bisecting glycans (see glycoengineering section). Additionally, a saturated signal was detected at approximately 50,000 net fluorescence intensity, exceeding the lectin chips’ dynamic range. For a more detailed analysis of specific N-glycan epitopes (core fucose, triantennary N-glycan, and sialic acids (SAs)) among glycoprotein samples, three paired samples were applied onto the LecChip-IgG-mAb and scanned after a 2 second exposure (c). The yellow line box on each image indicates the location of triplicate spots for each lectin specified above the image.
