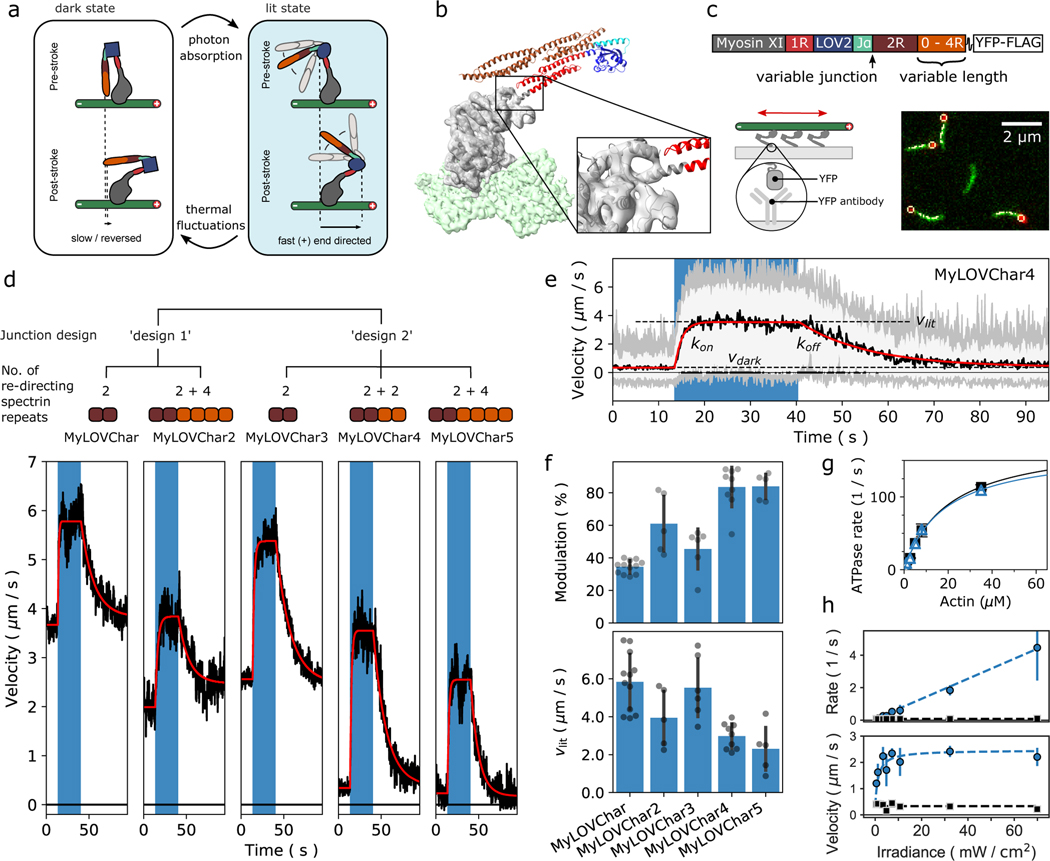
Figure 1. Engineering monomeric myosin XI motors for high speed and strong optical response.
a, Cartoon model of the mechanism of optical switching. b, Cryo-EM reconstruction of Chara corallina myosin XI catalytic domain (apo, grey) bound to F-actin (green) and post-stroke model of MyLOVChar (ribbon diagram) based on the cryo-EM model, with fused lever arm structure built from crystal structure fragments using RosettaRemodel (see also Extended Data Fig. 1d, 2a). c, Block diagram of the molecular construct, and schematic and snapshot of the gliding filament assay with automated tracking overlay. d, Representative velocity traces for a series of MyLOVChar variant constructs with two different junction designs and variable lengths of the redirected lever arm. Plotted velocities are the mean directionally scored frame-to-frame velocities of all moving filaments in a video frame, averaged over 3 to 5 sequential acquisitions of the same illumination sequence on the same field of view in one assay chamber (blue box indicates period of blue light illumination, with irradiance of 11 mW/cm2). Gliding assays were performed at 2mM ATP. Red lines are fits to the exponential rise and decay of the velocity. e, Velocity trace of MyLOVChar4 from d in more detail. Gray and white colored bands display the envelopes of the center 96 and 72 percentiles of the distribution of frame-to-frame velocities, respectively. The model fit (red line) yields the annotated rate constants and and the steady state velocities in the dark, , and in the presence of blue light,. f, Velocity modulation and lit-state velocity for the series of constructs in d, with each grey dot representing the result of an independent experiment analyzed as in e, and each bar displaying the mean ± standard deviation across the results shown (between N=5 and N=12 experiments depending on the construct). The velocity modulation is defined as and displayed as a percentage. g, ATPase activity of MyLOVChar4 measured with an NADH enzyme-coupled assay, with (blue datapoints) and without (black datapoints) blue light at an irradiance of 10 mW/cm2. Lines are fits to a Michaelis-Menten expression, with and without blue light (black line), and with blue light (blue line). Data are plotted as mean of 1–5 enzyme velocity measurements at each actin concentration (see Supplementary Fig. 3 for details including individual measurements and N values). Error bars display standard deviations for datasets with 3 or more measurements. h, Characterization of MyLOVChar4 as function of blue light intensity (see also Extended Data Fig. 3). Blue datapoints: (top) and (bottom). Black datapoints: (top) and (bottom). The dotted lines are fits to a dose response model, with , , and the slope of the rate dependence m = 0.062 s−1 mW−1 cm2 (see Methods). Each data point represents the mean ± standard deviation from 3 to 5 independently prepared assays (see Supplementary Figure 4 for details); for each assay, parameters were obtained as in e from velocity traces averaged over 3 sequential acquisitions of the stimulation sequence.

