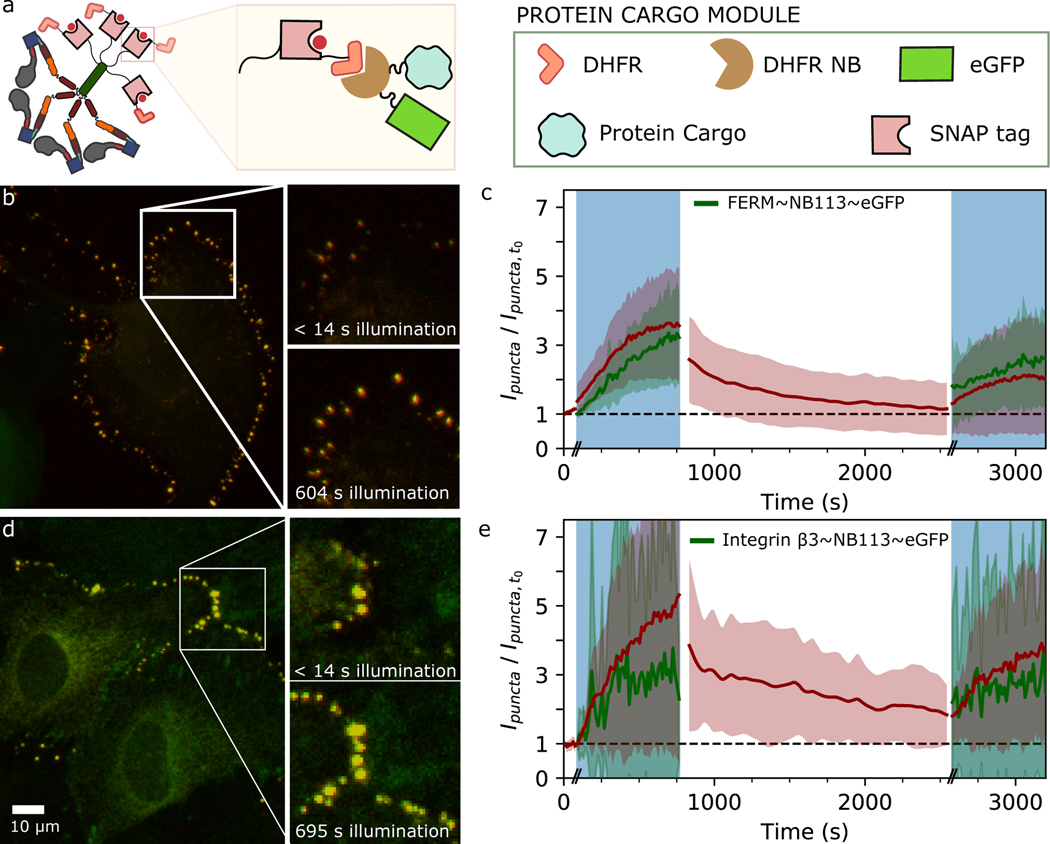
Figure 5. Optically controlled localization of motors and molecular cargos in live cells.
a, Schematic of MyLOVChar4~1R~TET~DFHR interacting with a protein cargo fused to a DFHR nanobody (NB113). b-c, Results from cells expressing MyLOVChar4~1R~TET~DFHR and FERM~NB113~eGFP. d-e, Results from cells expressing MyLOVChar4~1R~TET~DFHR and integrin β3~NB113~eGFP. b,d, Merged two-channel fluorescence images (maximum intensity projections of confocal z-stacks; red, motor; green, cargo) from sheets of MCF10A cells in culture, imaged with simultaneous 639 nm and 488 nm excitation. Images are representative of a set of 10 (in b) and 5 (in c) independent measurements, on 12 and 8 cells, respectively. c,e, Fluorescence intensity contained in puncta, normalized to values at the start of the imaging sequence, for motor (red) and cargo (green) channels. Results are averaged over individual time series (Supplementary Fig. 9 – 10) representing (c) 12 and (e) 8 cells, from 2 biological replicates in each case. Error bands are standard deviations of the measurements. Time axis includes approximate delays at transitions between the illumination phases (indicated by the double dashes), which for these experiments were collected as separate movies.

