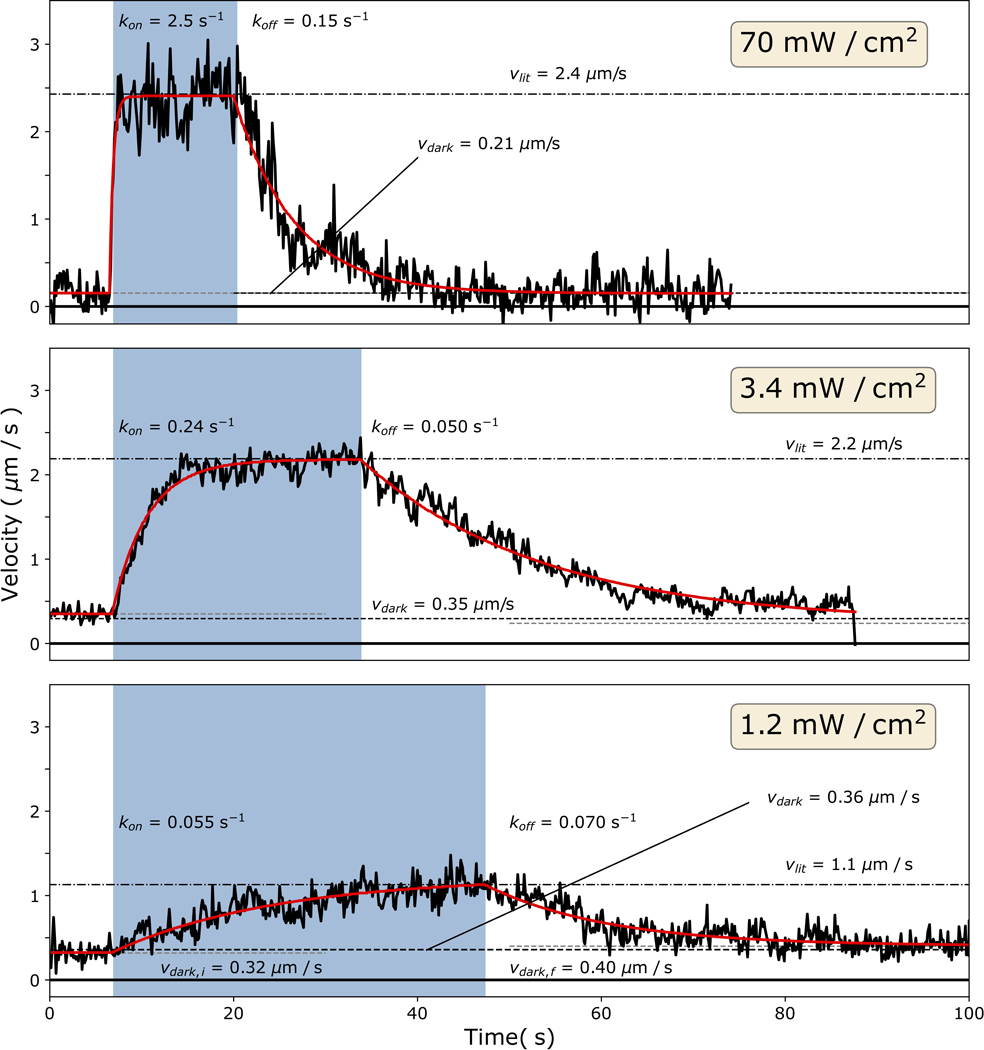
Extended Data Fig. 3. Velocity traces of gliding filament assays on MyLOVChar4 at variable blue light intensity.
The traces are selected from the dataset used to compose Fig. 1h in the main text. Each trace displays the frame-to-frame velocity at the annotated blue light irradiance (box in the top right corner), averaged over all tracked polarity labelled filaments in 2–3 consecutive repeats of the stimulation sequence. The initial dark velocity was taken as the mean velocity of the time before the start of the blue light stimulus, indicated by the left grey dashed lines, and annotated for the bottom plot. The subsequent parts of the trace were globally fit to an exponential rise and decay, extracting the characteristic rates and , the steady-state lit velocity (black dash-dotted lines), and the final velocity (right grey dashed lines, annotated for bottom plot). In Fig. 1e and Fig. 1h the dark velocity (black dashed lines) was reported, taken as the mean of and.

