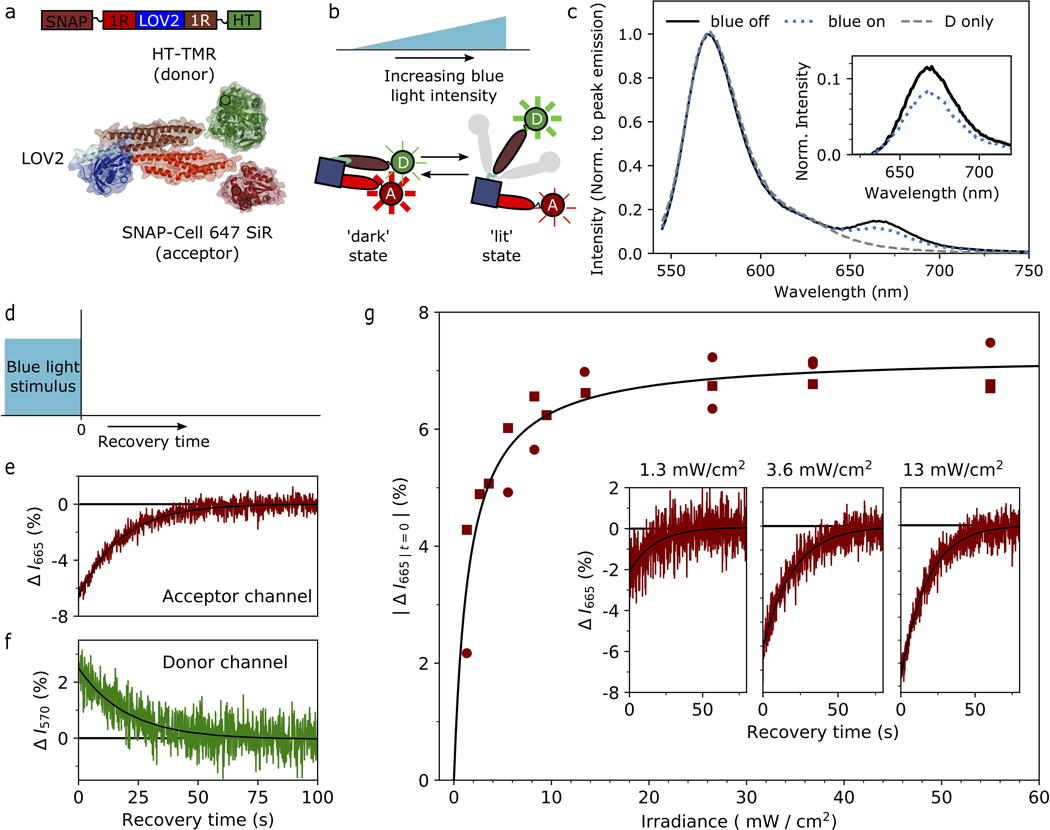
Extended Data Fig. 4. Dose-dependent conformational changes in a minimal LOV2-containing lever arm construct.
a, Block diagram and idealized molecular cartoon of a minimal lever-arm construct with N-terminal SNAP-tag and C-terminal HaloTag fusions (approximate positions shown). HaloTag was labeled with TMR (donor) and SNAP-tag with SNAP-Cell 647-SiR (acceptor) for fluorescence measurements. b, Schematic of light-dose dependent population of conformational states of the construct. Transparent elements in the lit state indicate increased flexibility. Positions of the fluorescent dyes are annotated (D: donor, A: acceptor). c, Fluorescence emission spectra normalized to the peak donor emission. Inset: extracted acceptor emission, obtained by subtracting the normalized emission from a donor-only sample from the normalized emission of the FRET sample. d, Schematic of the light stimulus experiment in bulk in solution. e-f,Time traces of fluorescence intensity immediately after a removal of a blue light stimulus (irradiance: 10 mW/cm2), with continued excitation of the donor dye. e, Fluorescence intensity collected at the emission maximum of the acceptor (665 nm). f, Fluorescence intensity collected at the emission maximum of the donor (570 nm), recorded on an independent run of the stimulus sequence, on the same sample as d using the same blue light irradiance. g, Amplitude of the normalized intensity difference of acceptor channel after recovery from a light stimulus as function of irradiance of the blue light, showing two replicate datasets (circular and square datapoints) taken on different days. Insets: time-dependent traces for measurements at the annotated irradiances. Black lines in e-f and insets in g are single exponential decays with amplitude A and characteristic time t. Listed in pairs (A, t), parameter values are e: (−7 %, 18 s), f: (+3 %, 20 s), g (left): (−2 %, 20 s), g (center): (−5 %, 20 s), g (right): (−7%, 18 s) s). Black line in g is a saturation curve with A=7 % at saturation, with half-saturation occurring at a dose of 1.6 mW/cm2 . The average decay time <t> over all n=20 experiments was 19 ± 1 s (mean ± s.e.m.).

