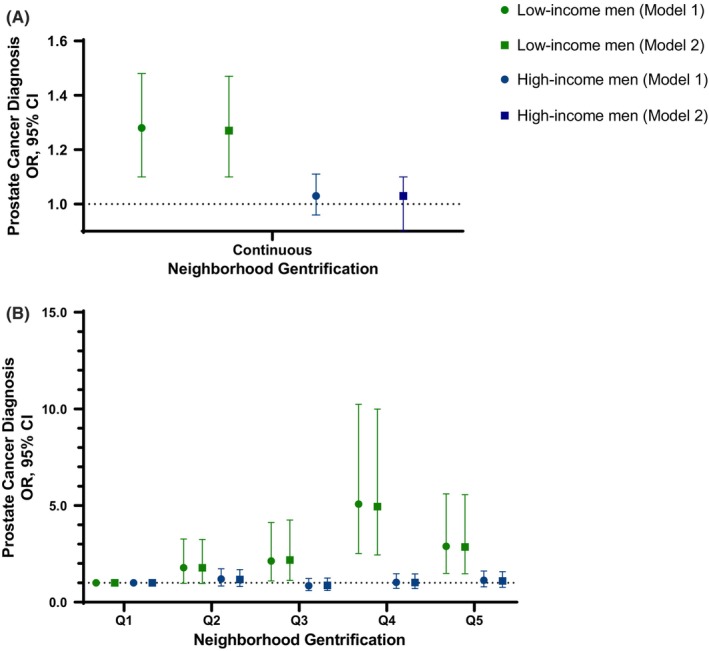
FIGURE 2.

Association of neighborhood gentrification with a prostate cancer diagnosis stratified by income. Odds ratios (OR) and 95% confidence interval (CI) for a prostate cancer diagnosis by neighborhood gentrification with gentrification coded as (A) continuous score and (B) quintiles, with additional stratification by self‐reported income. Low income = <$30,000, high income = ≥$30,000. Logistic regression with Model 1 being adjusted for all baseline covariates, whereas Model 2 adjusted for all covariates with the additional inclusion of education.
