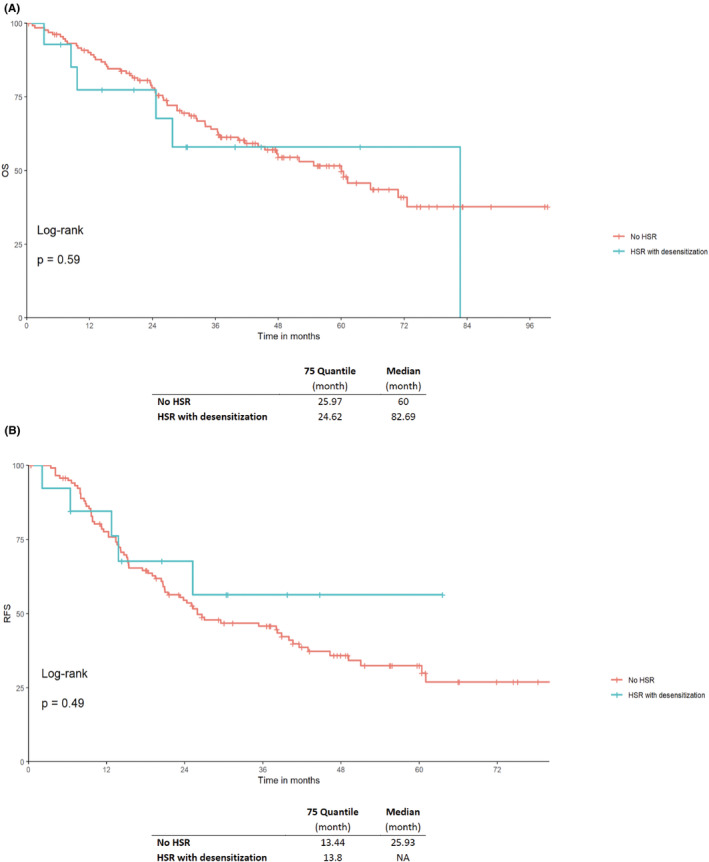
FIGURE 3.

Kaplan–Meier curves of (A) OS and (B) RFS of patients with taxane‐based chemotherapy and no hypersensitivity reaction (HSR) compared to patients with HSRs and successful desensitization and continuation of taxane chemotherapy in gynecologic cancers. A p‐value <0.05 was considered significant. HSR, hypersensitivity reaction; OS, overall survival; RFS, recurrence‐free survival.
