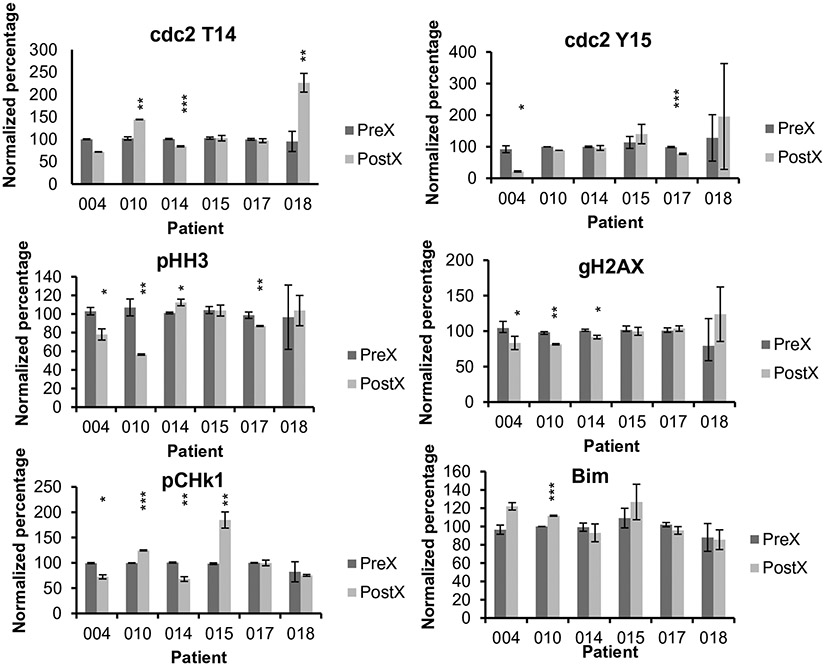
Fig. 1.
Flow cytometric analysis of pre- and post-treatment samples. PBMCs were isolated at baseline (Pre-) and 24 h after (Post*-) treatment. PBMC from each sample were analyzed for levels of Bim, p-cdc2 Y15, p-cdc2 T14, p-Chk1, gH2AX, and p-HH3. Analysis of biomarkers were performed on the CD45dim SSlow CD3-CD20-population. The mean fluorescence intensity (MFI) ratio of signal to its isocontrol for pretreatment samples from each patient was set as 100%. Results of analysis showed as bar charts displaying the relative levels of the assayed proteins in samples after averaging triplicate determinations, including standard deviation bars. Asterisks indicate significant post-treatment changes with * = significance with p values between 0.04 and 0.01; ** = significance with p values between 0.009 and 0.002; and *** = significance with p values between 0.0003 and 0.00007

