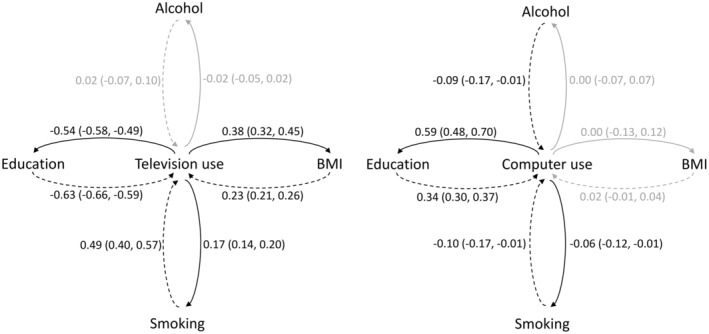
FIGURE 2.

Bidirectional associations of leisure time television watching and computer use with the four secondary traits: ΒΜΙ, years of education, smoking and alcohol. The solid lines correspond to the effects of time television watching and computer use on the four secondary traits while the dashed lines correspond to the effects of the four secondary traits on time television watching and computer use. The black colour corresponds to statistically significant associations and the grey colour to non‐significant. All the results, odds ratios and 95% confidence intervals correspond to a 1‐SD change in the levels of the variables. BMI, body mass index.
