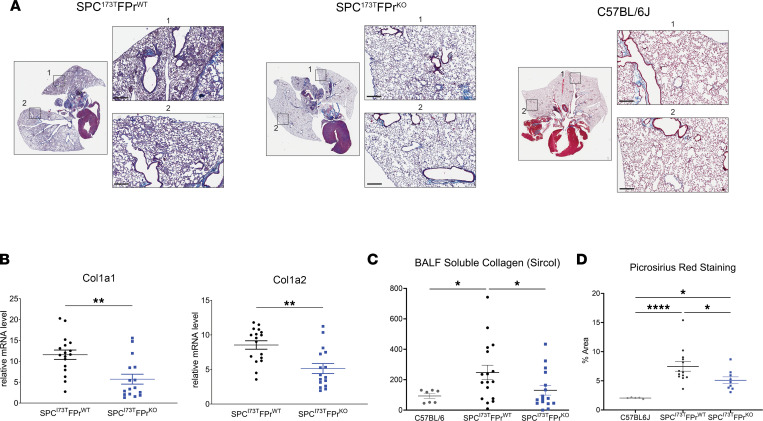
Figure 2. Ptgfr deficiency mitigates collagen expression and deposition after induction of SftpcI73T.
(A) Representative histology from IER-SftpcI73T/Ptgfr+/+ and IER-SftpcI73T/Ptgfr–/– mice 28 days after TAM and development of fibrosis. Images are derived from Masson’s trichrome–stained sections. Scale bars: 300 μM. (B) Relative fold mRNA levels between IER-SftpcI73T/Ptgfr+/+ and IER-SftpcI73T/Ptgfr–/– measured via qPCR demonstrates decreased Col1a1 and Col1a2 in IER-SftpcI73T/Ptgfr–/– mice 28 days after TAM induction. Statistical significance testing was performed using 2 tailed Welch’s t test. **P < 0.005. (C) Quantification of soluble collagen in BALF from mice during fibrotic remodeling reveals a lower concentration in IER-SftpcI73T/Ptgfr–/– mice. (D) PSR staining for collagen fibrils indicates mitigation of collagen deposition in IER-SftpcI73T/Ptgfr–/– mice. Quantification was performed using ImageJ; data represent percentage of total section area. All quantified data in this figure are derived from IER-SftpcI73T/Ptgfr+/+ (n = 17) and IER-SftpcI73T/Ptgfr–/– (n = 16). In C and D, ordinary 1-way ANOVA testing was performed. *P < 0.05, ****P < 0.00005.

