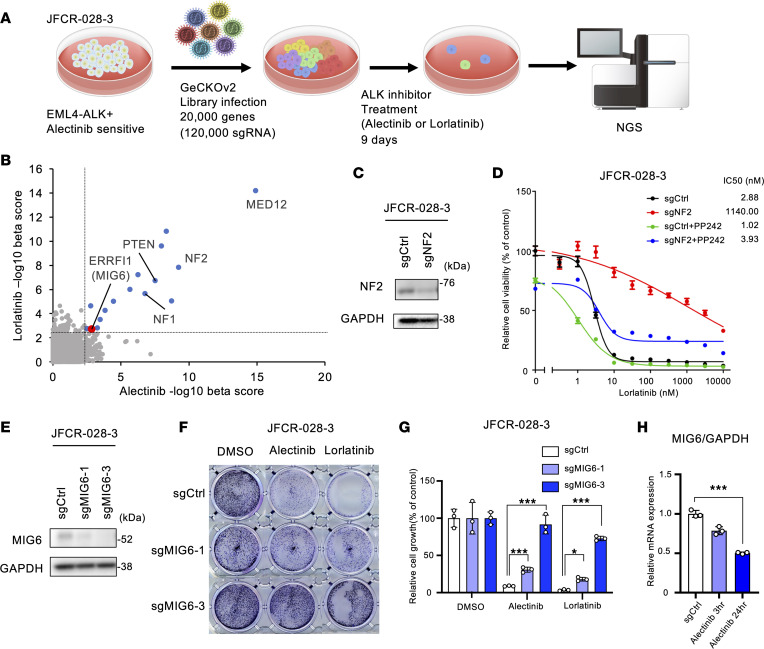
Figure 1. CRISPR library screening identifies MIG6 depletion in ALK-TKI–resistant cells.
(A) Schematic diagram of the workflow of genome-wide CRISPR/Cas9 library screening to identify critical genes related to alectinib and lorlatinib resistance in the JFCR-028-3 cell line. NGS, next-generation sequencing. (B) The abundance of sgRNA for each gene in CRISPR library screening was evaluated by the β-score using the MAGeCK algorithm. Positively selected genes after both alectinib and lorlatinib treatments (cutoff of –log10 β-score > 2.5) are indicated as blue dots. MIG6 (ERRFI1) is indicated as a red dot. (C) Immunoblot analysis of NF2 knocked out in JFCR-028-3 cells. (D) JFCR-028-3 cells were treated with the indicated concentrations of lorlatinib with or without 1 μmol/L of PP242 for 72 hours. Cell viability was measured using the CellTiter-Glo assay (n = 3). (E) Immunoblot analysis of MIG6 knocked out in JFCR-028-3 cells. (F and G) Colony formation assays were performed in JFCR-028-3 cells. JFCR-028-3 sg-control (Cntl) or sg-MIG6 cells were treated with 10 nmol/L of alectinib or 3 nmol/L of lorlatinib for 2 weeks. Surviving cells were stained with crystal violet. Representative images are shown in F. Relative cell viability was measured using a spectrophotometer after solubilizing the stained crystal violet with the acetic acid buffer from each well (G). (H) Quantitative reverse transcription PCR (RT-qPCR) of MIG6 mRNA was performed using JFCR-028-3 cells treated with 300 nmol/L of alectinib for the indicated hours. (C–H) Similar experiments were performed twice (C and E) or 3 times (D and F–H), and representative data are shown. Each point represents mean ± SD of 3 technical replicates; *P < 0.05, ***P < 0.001 (2-way ANOVA following Dunnett post hoc test).

