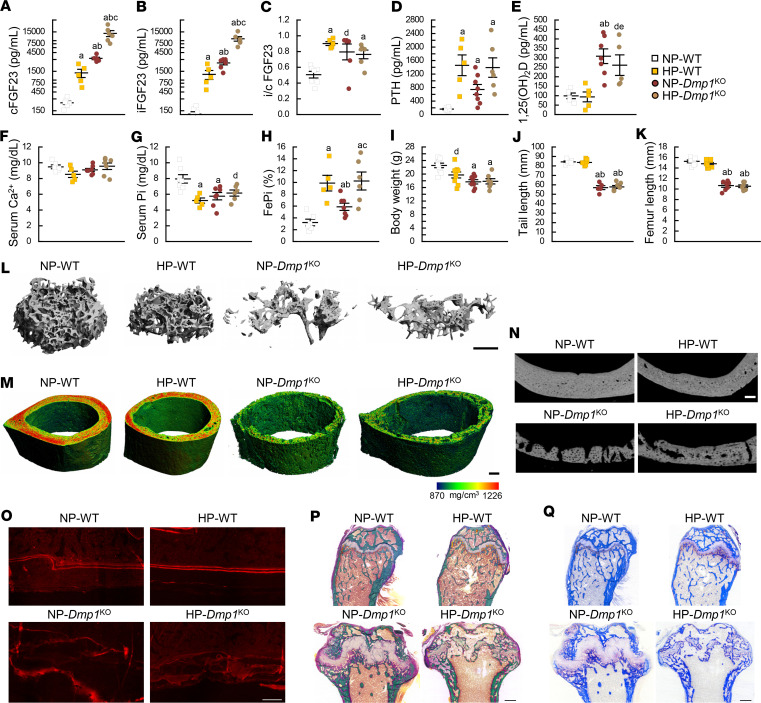
Figure 1. Dietary phosphate supplementation aggravates FGF23 excess and bone microarchitecture in Dmp1KO mice.
Serum levels of (A) total FGF23 (cFGF23), (B) intact FGF23 (iFGF23), (C) intact to total FGF23 ratio (i/c FGF23), (D) parathyroid hormone (PTH), (E) 1,25-dihydroxyvitamin D [1,25(OH)2D], (F) calcium (Ca2+), and (G) phosphate (Pi); (H) fractional excretion of Pi (FePi); (I) body weight, (J) tail length, and (K) femur length; 3D-μCT scan reconstruction of (L) distal femur trabecular metaphysis (scale bar = 200 μm); (M) midshaft femur cortical diaphysis (scale bar = 500 μm); (N) 2D μCT analysis of cortical bone porosity (scale bar = 100 μm); (O) red fluorescence microscopy imaging of alizarin red S–stained (ARS-stained) mineralization fronts; (P) bright-field microscopy imaging of modified trichrome Goldner staining; and (Q) tartrate-resistant acidic phosphatase (TRAcP) staining of longitudinal histology sections of distal femur (scale bar = 100 μm for ARS, 500 μm for Goldner and TRAcP). All analyses were performed in 12-week-old WT (n ≥ 5) and Dmp1KO (n ≥ 5) mice fed a diet containing 0.7% Pi (normal Pi, NP) or 2% Pi (high Pi, HP) from 6 to 12 weeks of age. Values are expressed as mean ± SEM; P < 0.05 vs. aNP-WT, bHP-WT, cNP-Dmp1KO; P < 0.1 vs. dNP-WT, eHP-WT. Statistical tests were ANOVA test followed by post hoc t tests and multiple-testing correction using Holm-Bonferroni method.

