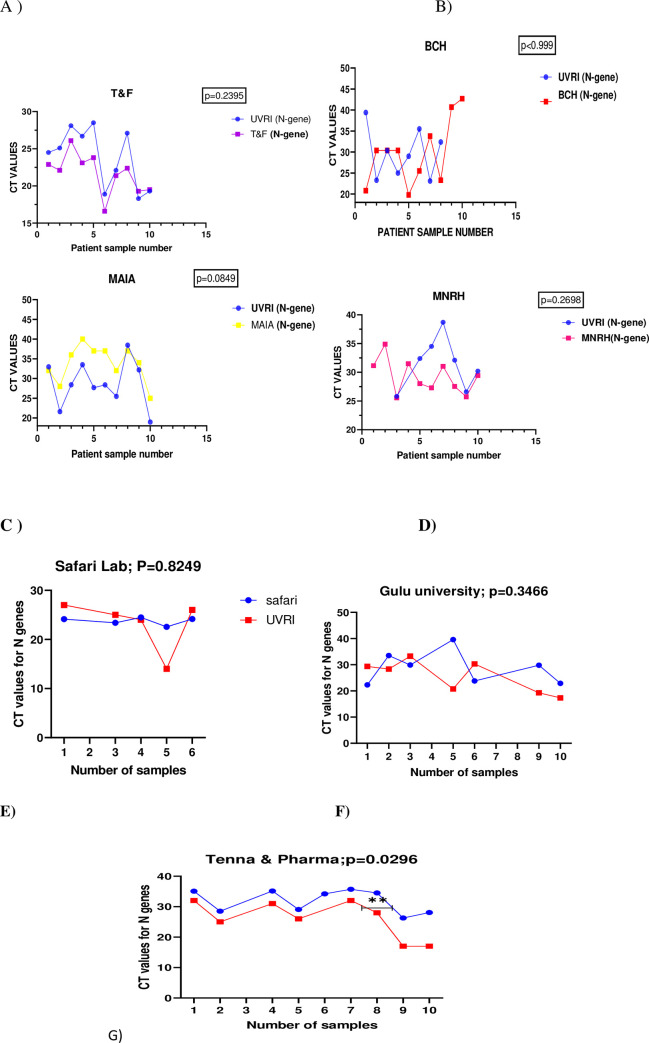
Fig 3. Line graphs comparing CT values of N genes of quality control samples from different facilities and the UVRI COVID19 National Reference Laboratory.
3A)CT value of Qc samples from Test & fly compared to UVRI, B)CT values of QC samples from Bwindi Community Hospital compared to UVRI, C) CT value of QC samples from MAIA compared to UVRI, D) CT values of QC samples from Mulago NRH compared to UVRI, E)CT values of QC samples from Safari Laboratory compared to that of UVRI, F)CT values of QC samples from Gulu University Laboratory compared to that of UVRI, G)CT values of QC samples from Tenna & Pharma Laboratory compared to that of UVRI.

