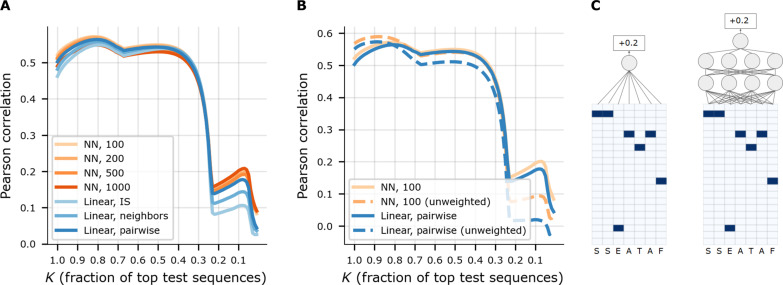
Fig. 2. Predictive model architectures and results.
(A) Comparison of models for predicting AAV5–7-mer packaging log enrichment scores, using Pearson correlation, and “top-K” Pearson correlation, where K denotes what fraction of top-ranked observed log enrichment test sequences were used. The correlation is between predicted and true log enrichment scores. Seven different models including four neural network (NN) architectures, distinguished by the number of nodes in the hidden layers (100, 200, 500, and 1000). (B) Similar plot to (A) except comparing the use of weighted versus unweighted sequences during training, for the final selected model, NN, 100, and a baseline, linear, pairwise. (C) Schematic illustrations of “linear, IS” (left) and “NN, 4” (right) predictive models. Each model predicts packaging log enrichment from peptide insertion sequence.

