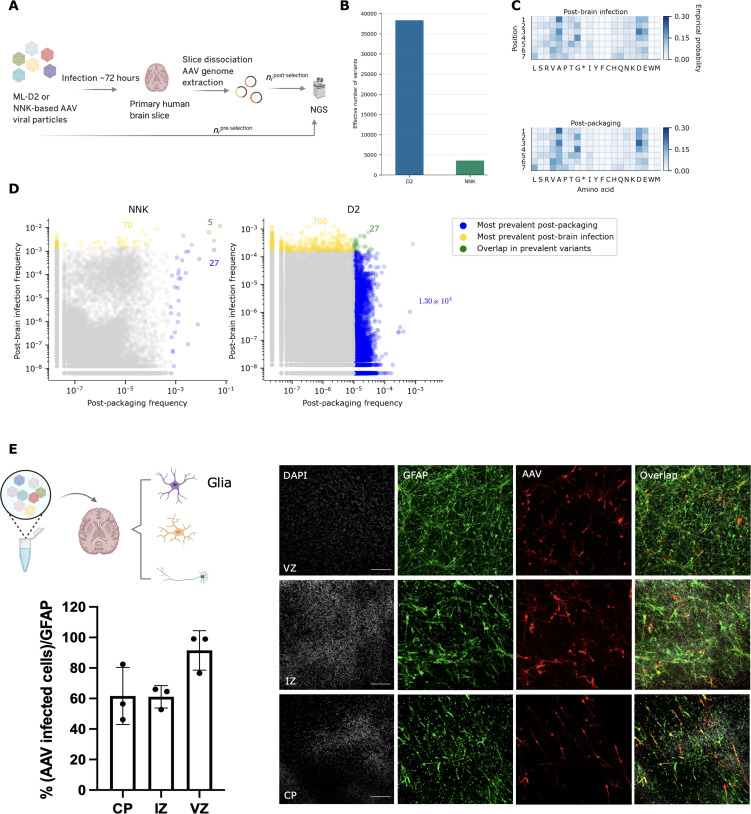
Fig. 6. ML-designed AAV library for primary brain tissue infection.
(A) General workflow of the primary adult brain infection study. (B) Effective number of variants (calculated from entropy) in NNK post-brain infection versus D2 post-brain infection; D2 post-brain infection exhibits a ~10-fold increase in effective number of variants compared to that of NNK post-brain infection. (C) Empirical probabilities of each amino acid at each position for D2 post-packaging and post-brain infection. (D) Scatterplots illustrating the behavior of individual variants over packaging and primary brain selection. Each axis shows the (log) prevalence of the variant in each library, as a fraction of reads in the library. For each library, variants in the top 20% are determined by first sorting unique variants by read count in descending order and then counting the number of unique variants comprising 20% of the total sequencing reads. Variants in the top 20% after packaging are colored blue, while those in the top 20% after brain selection are colored yellow. Those variants in the top 20% of both packaging and selection are colored green. The annotated colored numbers indicate the number of variants of each colored pool. A pseudo-count of 1 was added to each variant in each library before plotting. See fig. S11 for additional versions of (D) displaying variants in the top 50 and 80% of each library. (E) Cell-specific AAV validation (VVKQRGD) selected from the post-brain infection pool [green, glial fibrillary acidic protein (GFAP) marker; red, AAV infected cells; scale bars, 100 μm; CP, cortical plate; IZ, intermediate zone; VZ, ventricular zone; DAPI, 4′,6-diamidino-2-phenylindole). Schematic illustration created with BioRender.com.

