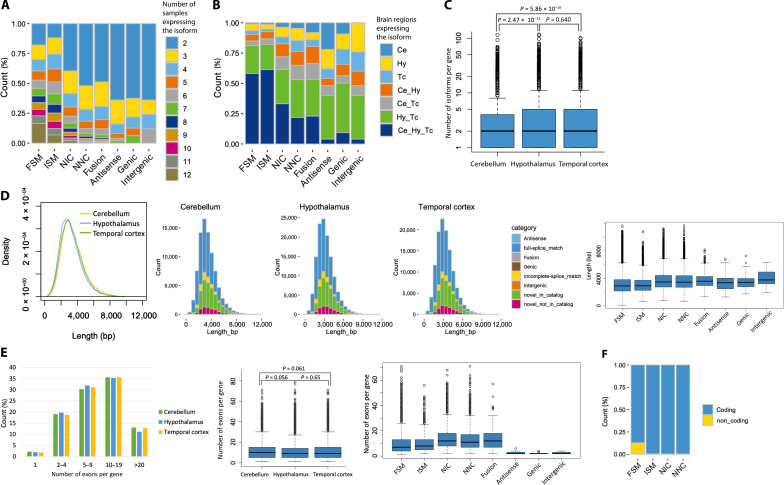
Fig. 2. Overview of the detected transcripts by category or brain region.
(A) Distribution of the number of samples in which the detected isoforms were found. Only isoforms that were expressed in at least two samples were included in subsequent analyses. (B) Distribution of the brain regions in which the detected isoforms were found. Ce, cerebellum; Hy, hypothalamus; Tc, temporal cortex. (C) Number of isoforms per gene in each brain region. The P value was calculated using a two-tailed t test. (D) Distribution of the read lengths of all detected isoforms by brain region. In the major four categories, NIC and NNC showed a tendency to have longer lengths. (E) Distribution of the number of exons per gene. The P value was calculated using a two-tailed t test. (F) Percentage of estimated protein-coding isoforms.

